library(tidyverse)
library(lubridate)
library(httr)
library(jsonlite)
library(knitr)
library(arrow)
library(here)7 Environmental Stressors and Social Complaints in New York City
8 Environmental Stressors and Social Complaints in New York City
Climate change increasingly affects urban environments through flooding, extreme weather, and infrastructure strain. Beyond physical impacts, environmental stressors may influence psychological well-being and social behavior, particularly in dense urban settings such as New York City. Environmental stress theory suggests that chronic exposure to environmental risk can heighten stress, frustration, and conflict within communities.
This project investigates whether environmental risk exposure, measured through flooding-related complaints, is associated with social indicators of anxiety, operationalized as noise complaints across New York City. By utilizing publicly available NYC Open Data, this project demonstrates how open civic data can be used to explore psychological and behavioral patterns at the community level in a reproducible way.
This analysis is framed as a proposal suitable for submission to NYC Open Data Week 2026 and emphasizes transparency, reproducibility, and civic relevance.
8.1 Research Question
How does exposure to environmental risk (measured by flooding complaints) relate to social indicators of anxiety (measured by noise complaints) across New York City boroughs?
8.2 Data Sources
This project uses four datasets from the NYC Open Data Portal:
- 311 Service Requests (Noise Complaints subset)
- 311 Service Requests (Flooding-related complaints subset)
- E-Designations
- Hazard Mitigation Plan - Mitigation Actions Database
Due to the size of the full 311 Service Requests dataset, noise complaint data were accessed via the NYC Open Data API. Smaller supporting datasets were downloaded and imported as Excel files. This mixed-format approach improves efficiency while maintaining transparency and reproducibility.
8.3 Reproducible Workflow
8.4 Loading Downloaded Excel Datasets
edesignation <- read_parquet(
  here("data", "raw", "E-Designations.parquet"),
  na = c("N/A", "NA", "")
)

hazard_mitigation <- read_parquet(
  here("data", "raw", "Hazard_Mitigation_Plan.parquet"),
  na = c("N/A", "NA", "")
)

street_flooding <- read_parquet(
  here("data", "raw", "Street_Flooding_Complaints.parquet"),
  na = c("N/A", "NA", "")
)
8.5 Accessing NYC Open Data via API (311 Noise Complaints)
To avoid downloading the full 311 dataset, noise complaints were retrieved using the NYC Open Data API. Only relevant variables and records were requested.
get_nyc_data <- function(url) {
  response <- GET(url)
  content(response, as = "text", encoding = "UTF-8") |>
    fromJSON(flatten = TRUE) |>
    as_tibble()
}
noise_url <- URLencode(paste0(
"https://data.cityofnewyork.us/resource/erm2-nwe9.json?",
"$select=unique_key,created_date,complaint_type,borough,city,",
"x_coordinate_state_plane,y_coordinate_state_plane&",
"$where=complaint_type LIKE 'Noise%' ",
"AND created_date >= '2018-01-01T00:00:00'&",
"$limit=50000"
))
noise <- get_nyc_data(noise_url)8.6 Data Cleaning and Preparation
Data were cleaned to ensure consistent borough labeling and proper date formatting. Complaint counts were aggregated at the borough-year level to allow comparisons across time and location.
noise_clean <- noise |>
  filter(!is.na(borough)) |>
  mutate(
    created_date = as.POSIXct(created_date),
    year = year(created_date),
    Borough = borough
  ) |>
  group_by(Borough, year) |>
  summarise(
    noise_complaints = n(),
    .groups = "drop"
  )

flood_clean <- street_flooding |>
  filter(!is.na(Borough)) |>
  mutate(
    created_date = as.POSIXct(`Created Date`),
    year = year(created_date)
  ) |>
  group_by(Borough, year) |>
  summarise(
    flood_complaints = n(),
    .groups = "drop"
  )
8.7 Merging Datasets
complaints <- left_join(
  flood_clean,
  noise_clean,
  by = c("Borough", "year")
)
8.8 Descriptive Statistics
kable(
  summary(complaints),
  caption = "Descriptive summary of borough-year flooding complaints and noise complaints (after merging datasets)."
)| Borough | year | flood_complaints | noise_complaints | |
|---|---|---|---|---|
| Length:87 | Min. :2010 | Min. : 1.0 | Min. : 1.00 | |
| Class :character | 1st Qu.:2014 | 1st Qu.: 220.5 | 1st Qu.: 8.25 | |
| Mode :character | Median :2018 | Median : 394.0 | Median : 509.50 | |
| NA | Mean :2018 | Mean : 512.8 | Mean :1275.53 | |
| NA | 3rd Qu.:2022 | 3rd Qu.: 765.5 | 3rd Qu.:1254.25 | |
| NA | Max. :2025 | Max. :1571.0 | Max. :8220.00 | |
| NA | NA | NA | NA’s :57 |
This summary provides an overview of variation in environmental risk exposure and social complaint behavior across boroughs and years.
8.9 Visualization 1: Flooding Complaints by Borough
ggplot(flood_clean, aes(x = Borough, y = flood_complaints)) +
  geom_col(fill = "#2a9d8f") +
  labs(
    title = "Street Flooding Complaints by Borough",
    x = "Borough",
    y = "Number of Flooding Complaints"
  ) +
  theme_minimal()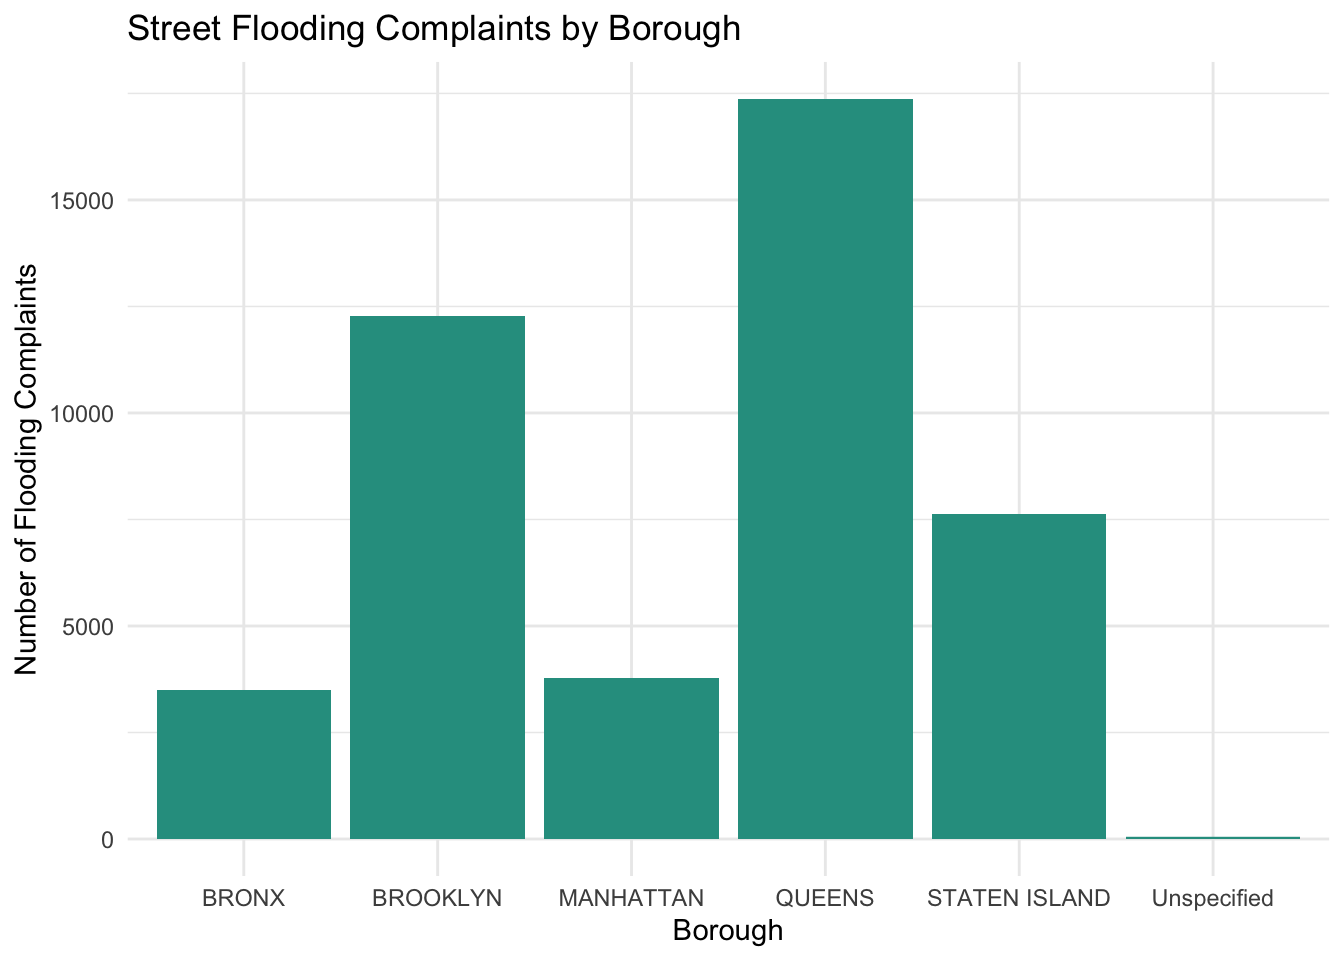
8.10 Visualization 2: Flooding and Noise Complaints
complaints <- complaints %>%
mutate(Borough = toupper(trimws(Borough)))ggplot(complaints, aes(x = flood_complaints, y = noise_complaints, color = Borough)) +
geom_point(size = 3, alpha = 0.7) +
geom_smooth(method = "lm", se = TRUE, color = "black") +
scale_color_manual(values = c(
"MANHATTAN" = "#2a9d8f",
"BROOKLYN" = "#264653",
"BRONX" = "#8ac926",
"QUEENS" = "#56c596",
"STATEN ISLAND" = "steelblue"
)) +
labs(
title = "Relationship Between Flooding and Noise Complaints",
x = "Flooding Complaints",
y = "Noise Complaints"
) +
theme_minimal()`geom_smooth()` using formula = 'y ~ x'Warning: Removed 57 rows containing non-finite outside the scale range
(`stat_smooth()`).Warning: Removed 57 rows containing missing values or values outside the scale range
(`geom_point()`).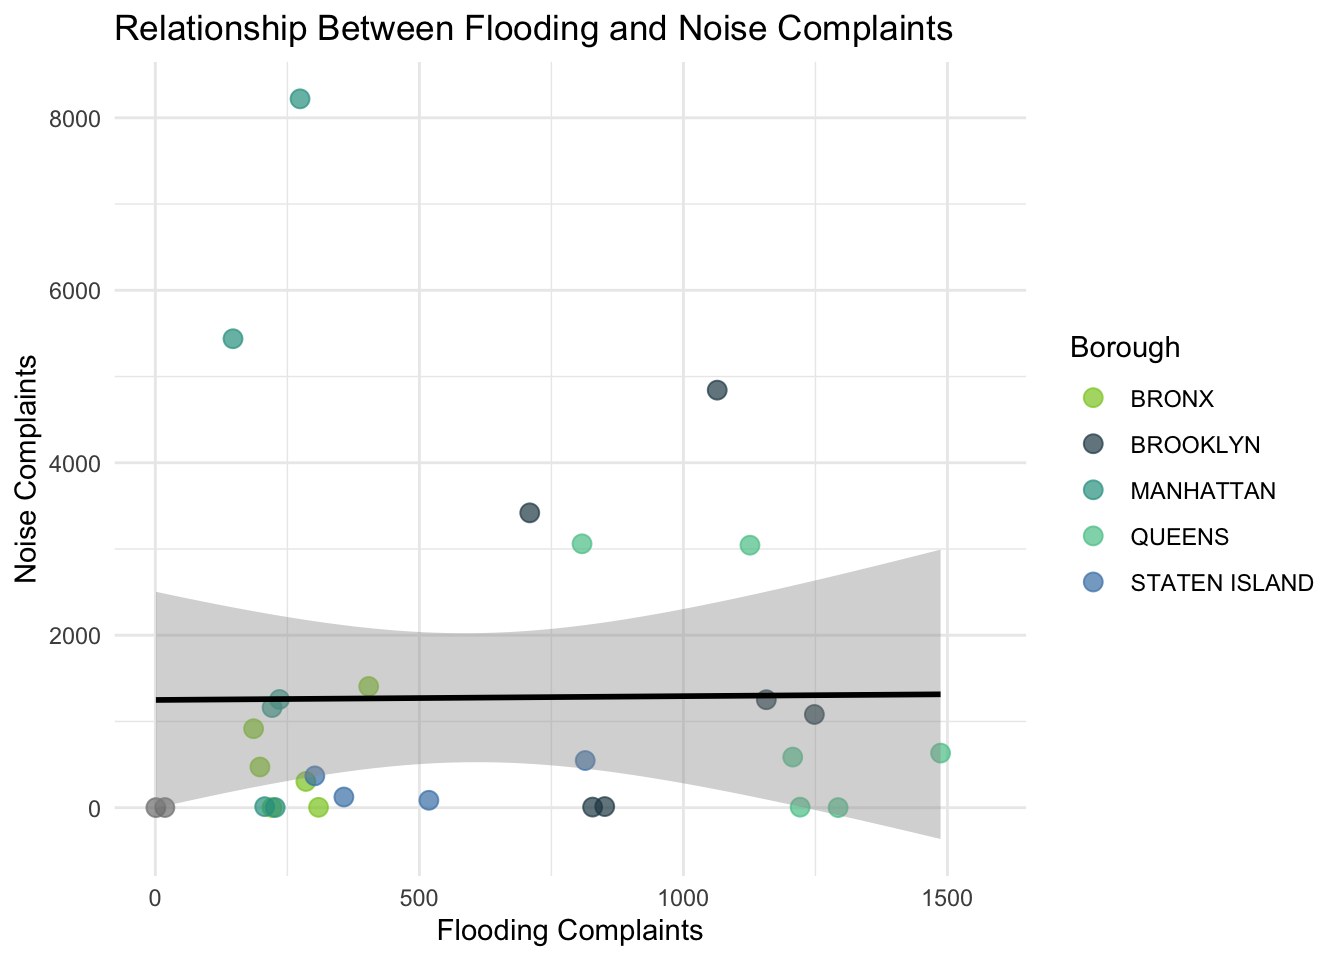
8.11 Statistical Analysis
model <- lm(noise_complaints ~ flood_complaints, data = complaints)

summary(model)
Call:
lm(formula = noise_complaints ~ flood_complaints, data = complaints)

Residuals:
    Min      1Q  Median      3Q     Max
-1305.1 -1248.2  -762.0   -15.5  6958.7

Coefficients:
                  Estimate Std. Error t value Pr(>|t|)
(Intercept)      1.249e+03  6.131e+02   2.038   0.0511 .
flood_complaints 4.402e-02  8.242e-01   0.053   0.9578
---
Signif. codes:  0 '***' 0.001 '**' 0.01 '*' 0.05 '.' 0.1 ' ' 1

Residual standard error: 2001 on 28 degrees of freedom
  (57 observations deleted due to missingness)
Multiple R-squared:  0.0001018, Adjusted R-squared:  -0.03561
F-statistic: 0.002852 on 1 and 28 DF,  p-value: 0.9578
8.12 Results
The regression analysis evaluates whether higher levels of flooding complaints are associated with increased noise complaints. A positive relationship would align with environmental stress theory, suggesting that climate-related disruptions may be linked to heightened social tension and anxiety-related behaviors.
8.13 Discussion
This project demonstrates how climate-related environmental stressors may influence social behavior in urban environments. Flooding represents a tangible, recurring disruption, while noise complaints may reflect increased frustration or conflict within communities. Together, these indicators provide insight into how climate risk may shape everyday social experiences in New York City.
By integrating psychological theory with open civic data, this analysis highlights the value of interdisciplinary approaches to understanding climate impacts.
8.14 Limitations and Future Directions
311 complaint data reflect reporting behavior rather than direct psychological measurement and may vary by access to city services or trust in government. Future work could incorporate demographic or spatial analyses, examine temporal patterns around extreme weather events, or integrate measures of pro-environmental behavior and peer influence.
8.15 Connection to Open Data
This project emphasizes transparency and reproducibility by combining downloaded open datasets with API-based data access. NYC Open Data enables researchers and communities to explore complex environmental and social issues using publicly accessible information, supporting informed decision-making and civic engagement.
8.16 Conclusion
Environmental stressors associated with climate change may have meaningful social and psychological consequences in urban settings. Using NYC Open Data, this project provides a reproducible framework for examining how environmental risk relates to social indicators of anxiety across New York City. These findings underscore the importance of incorporating psychological perspectives into climate resilience planning.