1Leading Causes of Death and Indoor Environmental Complaints
Author
Crystal Adote
1.1 Leading Causes of Death and Indoor Environmental Complaints
This project examines the leading causes of death in NYC from 2007 - 2014, and indoor environmental complaints such as mold, indoor air quality, asbestos and more from 2010 - present. I want to explore each data set and see if there are any possible relationships between the 2 data sets. I will be doing this by creating visuals and running a statistical test.
1.2 Loading Libraries and importing data sets
Show the code
library(tidyverse)
Warning: package 'tidyr' was built under R version 4.5.2
Warning: package 'readr' was built under R version 4.5.2
Warning: package 'purrr' was built under R version 4.5.2
── Attaching core tidyverse packages ──────────────────────── tidyverse 2.0.0 ──
✔ dplyr     1.1.4     ✔ readr     2.1.5
✔ forcats   1.0.1     ✔ stringr   1.6.0
✔ ggplot2   4.0.0     ✔ tibble    3.3.0
✔ lubridate 1.9.4     ✔ tidyr     1.3.1
✔ purrr     1.2.0
── Conflicts ────────────────────────────────────────── tidyverse_conflicts() ──
✖ dplyr::filter() masks stats::filter()
✖ dplyr::lag()    masks stats::lag()
ℹ Use the conflicted package (<http://conflicted.r-lib.org/>) to force all conflicts to become errors
Show the code
library(skimr)
Warning: package 'skimr' was built under R version 4.5.2
Show the code
library(readxl)
Warning: package 'readxl' was built under R version 4.5.2
Warning: package 'arrow' was built under R version 4.5.2
Attaching package: 'arrow'

The following object is masked from 'package:lubridate':

    duration

The following object is masked from 'package:utils':

    timestamp
In this section I loaded all of the packages that were used throughout the project. The 2 data sets used in this project are the ‘Leading Causes of Death’ and ‘Indoor Environmental Complaints’ data from 311 which could both be found on the NYC Open data website.
1.3 Cleaning the data sets
Show the code
indoor_complaints<-select(indoor_complaints, -Incident_Address)indoor_complaints<-select(indoor_complaints, -Incident_Address_Street_Number)indoor_complaints<-select(indoor_complaints, -Incident_Address_Street_Name)indoor_complaints<-select(indoor_complaints, -Incident_Address_Zip)indoor_complaints<-select(indoor_complaints, -Complaint_Status)indoor_complaints<-select(indoor_complaints, -Latitude)indoor_complaints<-select(indoor_complaints, -Longitude)indoor_complaints<-select(indoor_complaints, -`Community Board`)indoor_complaints<-select(indoor_complaints, -`Council District`)indoor_complaints<-select(indoor_complaints, -`Census Tract`)indoor_complaints<-select(indoor_complaints, -BIN)indoor_complaints<-select(indoor_complaints, -BBL)indoor_complaints<-select(indoor_complaints, -NTA)indoor_complaints<-select(indoor_complaints, -Deleted)indoor_complaints<-select(indoor_complaints, -Complaint_Number)indoor_complaints<-select(indoor_complaints, -Descriptor_1_311)indoor_complaints<-select(indoor_complaints, -Incident_Address_Borough)indoor_complaints$Date_Received<-year(indoor_complaints$Date_Received)indoor_complaints<- indoor_complaints %>%rename(Year = Date_Received)indoor_complaints<- indoor_complaints %>%rename(complaint_type = Complaint_Type_311)causes_of_death<-select(causes_of_death, -`Death Rate`)causes_of_death<-select(causes_of_death, -`Age Adjusted Death Rate`)causes_of_death<-select(causes_of_death, -Sex)causes_of_death<-select(causes_of_death, -`Race Ethnicity`)causes_of_death<-select(causes_of_death, -Deaths)causes_of_death<- causes_of_death %>%rename(cause_of_death =`Leading Cause`)indoor_complaints<- indoor_complaints %>%mutate(complaint_type =recode( complaint_type,"MOLD"="Mold","Asbestos/Garbage Nuisance"="Garbage Nuisance","LEAD"="Lead","NEW YORK"="NY","ASBESTOS"="Asbestos","IAQ"="Indoor Air Quality" ))indoor_complaints<- indoor_complaints %>%filter(!complaint_type %in%c("NY", "100", "04727995"))causes_of_death<- causes_of_death %>%filter(!cause_of_death %in%c("Human Immunodeficiency Virus Disease (HIV: B20-B24)", "Intentional Self-Harm (Suicide: X60-X84, Y87.0)","Essential Hypertension and Renal Diseases (I10, I12)", "Diabetes Mellitus (E10-E14)", "Mental and Behavioral Disorders due to Accidental Poisoning and Other Psychoactive Substance Use (F11-F16, F18-F19, X40-X42, X44)","Accidents Except Drug Posioning (V01-X39, X43, X45-X59, Y85-Y86)", "All Other Causes", "Certain Conditions originating in the Perinatal Period (P00-P96)", "Chronic Liver Disease and Cirrhosis (K70, K73)", "Nephritis, Nephrotic Syndrome and Nephrisis (N00-N07, N17-N19, N25-N27)", "Alzheimer's Disease (G30)", "Assault (Homicide: Y87.1, X85-Y09)", "Congenital Malformations, Deformations, and Chromosomal Abnormalities (Q00-Q99)","Septicemia (A40-A41)", "Viral Hepatitis (B15-B19)", "Aortic Aneurysm and Dissection (I71)", "Parkinson's Disease (G20)","Tuberculosis (A16-A19)","Mental and Behavioral Disorders due to Use of Alcohol (F10)", "Insitu or Benign / Uncertain Neoplasms (D00-D48)", "Atherosclerosis (I70)"))complaints_summary<- indoor_complaints %>%add_count(complaint_type, name ="Number of Complaints")deaths_summary <- causes_of_death %>%group_by(cause_of_death) %>%summarise(`Number of Deaths`=n(), .groups ="drop")
Here, I cleaned the 2 data sets and took out the columns that I don’t need. I also made the complaint type names match, (e.g., “MOLD” and “Mold”) and took out “NY”, “04727995”, and “100” because they aren’t complaints/a type of complaint. I also took out many causes of death so I can focus on just 5 common/well known causes such as ‘Chronic Lower Respiratory Diseases’ for example, for easier analyses and exploration among the 2 data sets. I also added the calculated number of complaints and death as a column in each data set.
1.4 Looking at both data sets
Show the code
death_causes_cont_table<-table(causes_of_death$Year, causes_of_death$cause_of_death)kable(death_causes_cont_table, caption ="Contingency table showing counts of deaths by year and cause of death.")
Table 1.1: Contingency table showing counts of deaths by year and cause of death.
Cerebrovascular Disease (Stroke: I60-I69)
Chronic Lower Respiratory Diseases (J40-J47)
Diseases of Heart (I00-I09, I11, I13, I20-I51)
Influenza (Flu) and Pneumonia (J09-J18)
Malignant Neoplasms (Cancer: C00-C97)
2007
11
11
12
12
12
2008
11
11
12
12
12
2009
11
11
12
12
12
2010
12
11
12
12
12
2011
10
12
12
12
12
2012
12
10
12
12
12
2013
11
11
12
12
12
2014
12
11
12
12
12
Show the code
enviro_complaint_cont_table<-table(indoor_complaints$Year, indoor_complaints$complaint_type)kable(enviro_complaint_cont_table,caption ="Contingency table showing counts of indoor environmental complaints by year and complaint type")
Table 1.2: Contingency table showing counts of indoor environmental complaints by year and complaint type
Asbestos
Cooling Tower
Garbage Nuisance
Indoor Air Quality
Indoor Sewage
Lead
Mold
2010
247
0
0
2309
0
0
64
2011
576
0
0
4148
0
0
225
2012
500
0
0
4149
0
0
321
2013
459
0
0
4458
0
0
410
2014
493
0
0
4985
0
0
439
2015
523
0
0
4808
0
0
344
2016
494
0
1
4349
0
1
313
2017
457
14
0
4407
863
0
346
2018
563
0
0
4571
1131
0
438
2019
573
0
0
3777
1293
0
414
2020
412
0
0
3956
1201
0
188
2021
527
0
0
5916
238
0
291
2022
553
0
0
5999
0
0
282
2023
594
0
0
7026
0
0
347
2024
575
0
0
8324
0
0
381
2025
524
0
0
8095
0
0
381
I created a contingency table for both data sets. For the ‘Leading Causes of Death’ data set, I looked at the year and the cause of death to see how many deaths occurred due to the specific cause each year. For example, there were 12 recorded deaths due to a heart disease in 2007.
For the ‘Indoor Environmental Complaints’ data set, I also looked at years and complaint types to see how many complaints were made each year. For example, in 2012, there were 500 complaints of asbestos filed.
1.5 Visualizations
Show the code
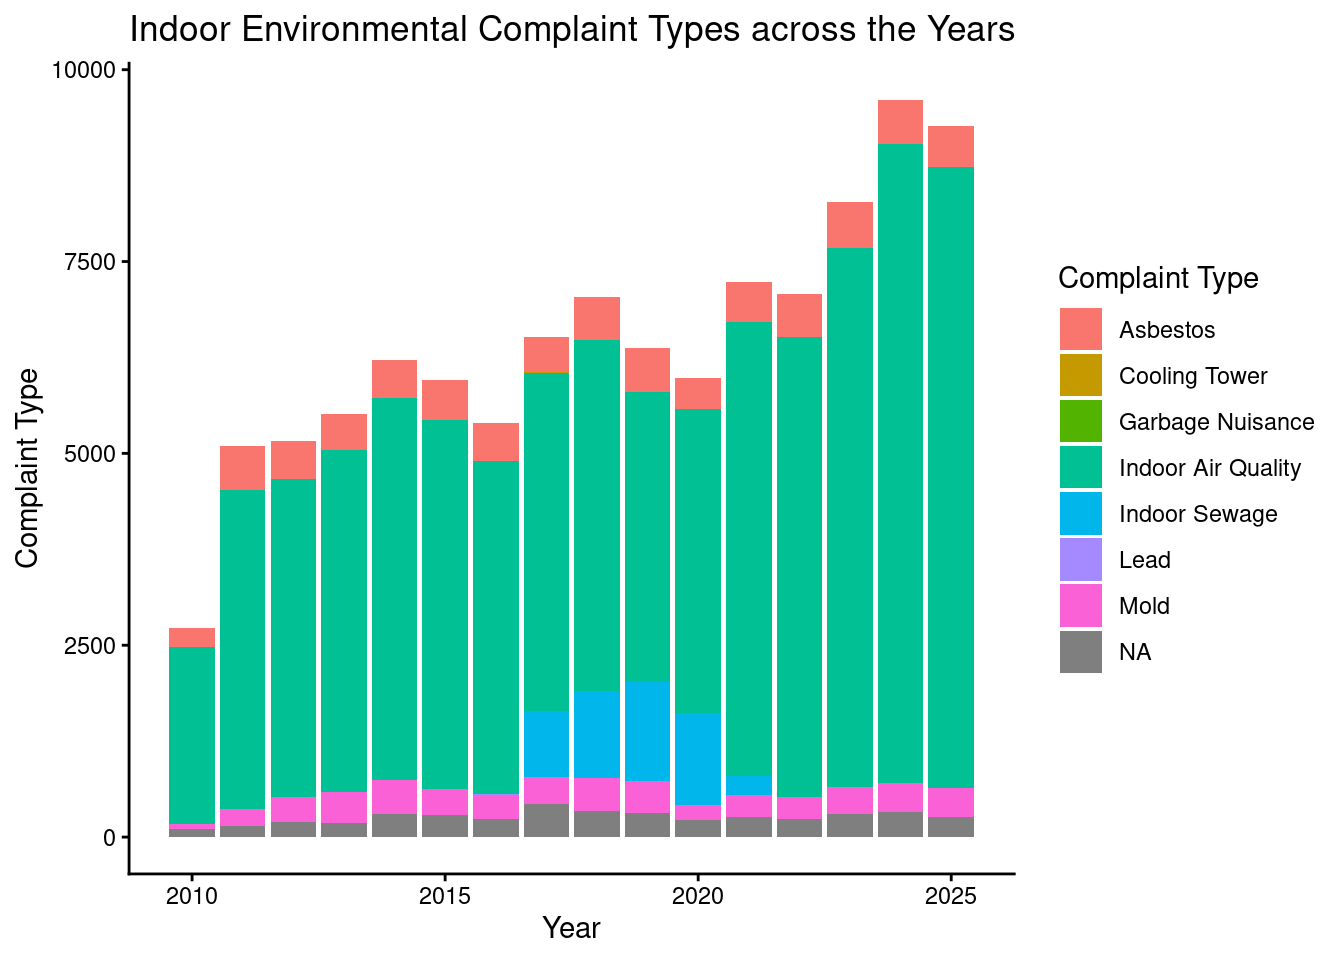
complaint_and_year<-ggplot(indoor_complaints, aes(x=Year, fill=complaint_type))+geom_bar()+labs(title="Indoor Environmental Complaint Types across the Years",x="Year",y="Complaint Type",fill="Complaint Type" ) +theme_classic()complaint_and_year
Figure 1.1: This stacked bar graph conveys the amount of indoor environmental complaints over the years
This stacked bar graph shows the amount of different complaints that were submitted from 2010 - present. Indoor Air Quality was the most indoor environmental complaint filed every year. It makes you wonder if there could be a relationship between these complaints and causes of death.
Show the code
death_counts<- causes_of_death %>%count(Year, cause_of_death)kable(death_counts, caption ="Table of the total causes_of_death for each Year")
Table 1.3: Table of the total causes_of_death for each Year
Year
cause_of_death
n
2007
Cerebrovascular Disease (Stroke: I60-I69)
11
2007
Chronic Lower Respiratory Diseases (J40-J47)
11
2007
Diseases of Heart (I00-I09, I11, I13, I20-I51)
12
2007
Influenza (Flu) and Pneumonia (J09-J18)
12
2007
Malignant Neoplasms (Cancer: C00-C97)
12
2008
Cerebrovascular Disease (Stroke: I60-I69)
11
2008
Chronic Lower Respiratory Diseases (J40-J47)
11
2008
Diseases of Heart (I00-I09, I11, I13, I20-I51)
12
2008
Influenza (Flu) and Pneumonia (J09-J18)
12
2008
Malignant Neoplasms (Cancer: C00-C97)
12
2009
Cerebrovascular Disease (Stroke: I60-I69)
11
2009
Chronic Lower Respiratory Diseases (J40-J47)
11
2009
Diseases of Heart (I00-I09, I11, I13, I20-I51)
12
2009
Influenza (Flu) and Pneumonia (J09-J18)
12
2009
Malignant Neoplasms (Cancer: C00-C97)
12
2010
Cerebrovascular Disease (Stroke: I60-I69)
12
2010
Chronic Lower Respiratory Diseases (J40-J47)
11
2010
Diseases of Heart (I00-I09, I11, I13, I20-I51)
12
2010
Influenza (Flu) and Pneumonia (J09-J18)
12
2010
Malignant Neoplasms (Cancer: C00-C97)
12
2011
Cerebrovascular Disease (Stroke: I60-I69)
10
2011
Chronic Lower Respiratory Diseases (J40-J47)
12
2011
Diseases of Heart (I00-I09, I11, I13, I20-I51)
12
2011
Influenza (Flu) and Pneumonia (J09-J18)
12
2011
Malignant Neoplasms (Cancer: C00-C97)
12
2012
Cerebrovascular Disease (Stroke: I60-I69)
12
2012
Chronic Lower Respiratory Diseases (J40-J47)
10
2012
Diseases of Heart (I00-I09, I11, I13, I20-I51)
12
2012
Influenza (Flu) and Pneumonia (J09-J18)
12
2012
Malignant Neoplasms (Cancer: C00-C97)
12
2013
Cerebrovascular Disease (Stroke: I60-I69)
11
2013
Chronic Lower Respiratory Diseases (J40-J47)
11
2013
Diseases of Heart (I00-I09, I11, I13, I20-I51)
12
2013
Influenza (Flu) and Pneumonia (J09-J18)
12
2013
Malignant Neoplasms (Cancer: C00-C97)
12
2014
Cerebrovascular Disease (Stroke: I60-I69)
12
2014
Chronic Lower Respiratory Diseases (J40-J47)
11
2014
Diseases of Heart (I00-I09, I11, I13, I20-I51)
12
2014
Influenza (Flu) and Pneumonia (J09-J18)
12
2014
Malignant Neoplasms (Cancer: C00-C97)
12
Show the code
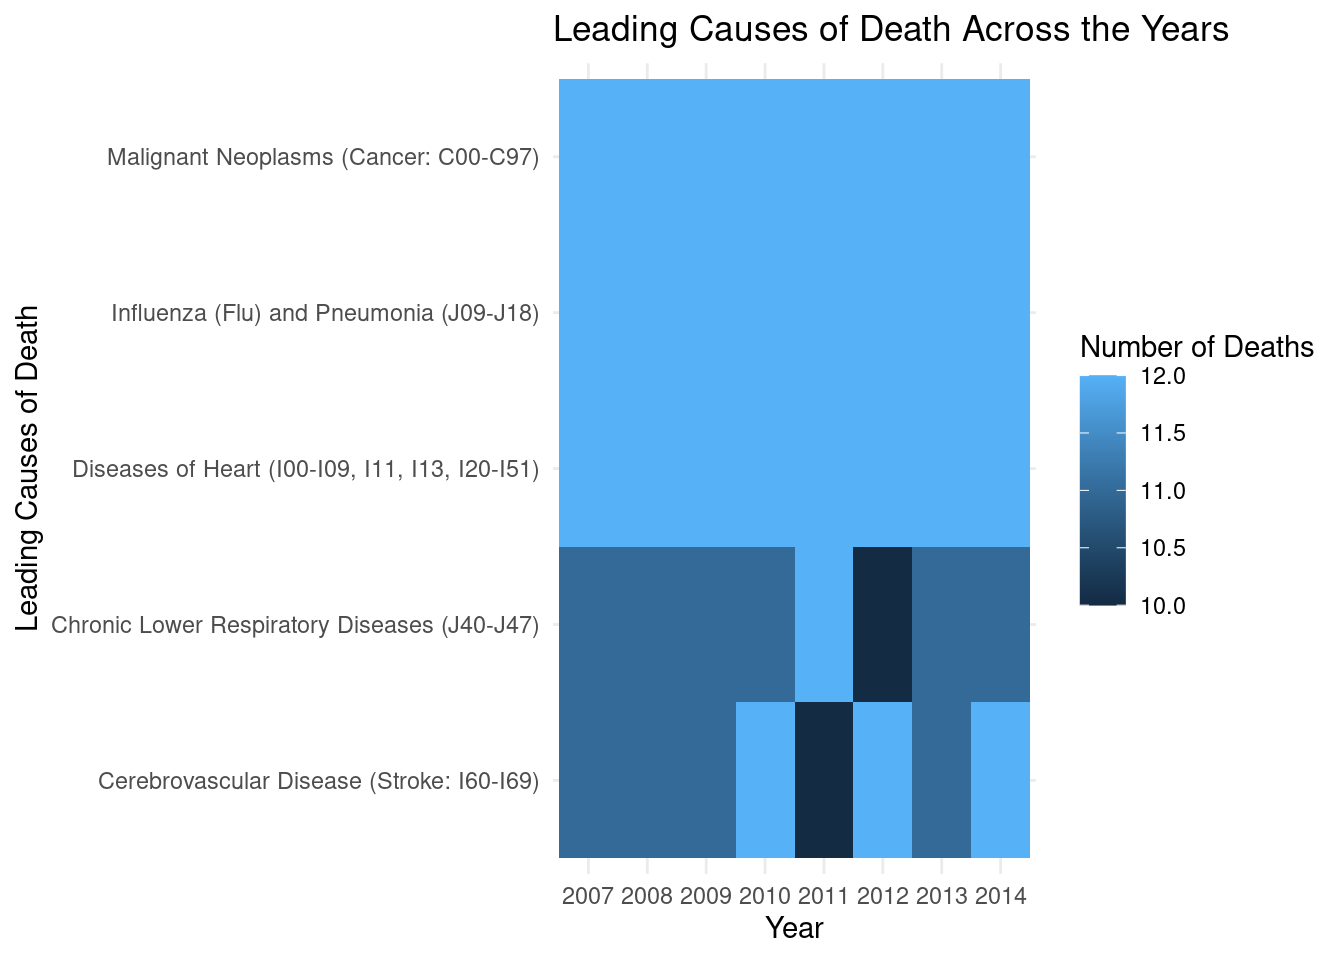
death_causes_and_year<-ggplot(death_counts, aes(x=Year, y=cause_of_death, fill=n))+geom_tile()+labs(title="Leading Causes of Death Across the Years",x="Year",y="Leading Causes of Death",fill="Number of Deaths" ) +theme_minimal()death_causes_and_year
Figure 1.2: This is a Heatmap that conveys 5 of the leading causes of death over the years
This is a heatmap which conveys the 5 causes of death that I chose to examine for this project, just to note, these are not the top 5 leading causes of death in the data. The map shows the amount of deaths and their causes from 2007 - 2014. We can see that throughout all 7 years that data was collected, cancer, the flu and pneumonia, and diseases of the heart were consecutively the cause of the most amount of deaths. I created a table that groups the leading causes of death data by year and causes of death and records the amount of deaths happened due to those causes. Then, I used the information from that table to create the heatmap.
1.6 Pairing Complaint types with Causes of Death
Show the code
pairing_death_complaints <-tribble(~complaint_type, ~cause_of_death,"Indoor Air Quality", "Influenza (Flu) and Pneumonia (J09-J18)","Mold", "Chronic Lower Respiratory Diseases (J40-J47)","Asbestos", "Malignant Neoplasms (Cancer: C00-C97)","Lead", "Cerebrovascular Disease (Stroke: I60-I69)","Lead", "Diseases of Heart (I00-I09, I11, I13, I20-I51)","Cooling Tower", "Influenza (Flu) and Pneumonia (J09-J18)","Indoor Sewage", "Viral Hepatitis (B15-B19)","Garbage Nuisance", "Influenza (Flu) and Pneumonia (J09-J18)")
I created a separate data set where I would be able to pair certain complaint types with causes of death. This data set does not convey that the complaint type is the reason for the cause of death. This is just my assumption, and should not be seen as real and/or correct information or causation.
Warning in left_join(., pairing_death_complaints, by = "cause_of_death"): Detected an unexpected many-to-many relationship between `x` and `y`.
ℹ Row 1 of `x` matches multiple rows in `y`.
ℹ Row 3 of `y` matches multiple rows in `x`.
ℹ If a many-to-many relationship is expected, set `relationship =
  "many-to-many"` to silence this warning.
I took out the ‘Year’ column in both data sets before starting to merge, because of the different ranges of years that each data set has. So in this analysis, we will not be examining data over time/the years due to the complication and inaccuracy that will come from the results.
1.8 Merged Data
Show the code
death_and_complaints <- complaints_summary %>%left_join(pairing_death_complaints, by ="complaint_type") %>%left_join(deaths_summary, by ="cause_of_death")
Show the code
death_and_complaints<- death_and_complaints %>%select(-Year)death_and_complaints<- death_and_complaints %>%filter(!is.na(complaint_type),!is.na(cause_of_death),!is.na(`Number of Deaths`) )kable(death_and_complaints,caption ="First 15 rows of the death_and_complaints table.") %>%head(15)
Table 1.4
Warning in left_join(., pairing_death_complaints, by = "complaint_type"): Detected an unexpected many-to-many relationship between `x` and `y`.
ℹ Row 34830 of `x` matches multiple rows in `y`.
ℹ Row 3 of `y` matches multiple rows in `x`.
ℹ If a many-to-many relationship is expected, set `relationship =
  "many-to-many"` to silence this warning.
 [1] "Table: First 15 rows of the death_and_complaints table."
 [2] ""
 [3] "|complaint_type     | Number of Complaints|cause_of_death                                 | Number of Deaths|"
 [4] "|:------------------|--------------------:|:----------------------------------------------|----------------:|"
 [5] "|Asbestos           |                 8070|Malignant Neoplasms (Cancer: C00-C97)          |               96|"
 [6] "|Indoor Air Quality |                81277|Influenza (Flu) and Pneumonia (J09-J18)        |               96|"
 [7] "|Asbestos           |                 8070|Malignant Neoplasms (Cancer: C00-C97)          |               96|"
 [8] "|Asbestos           |                 8070|Malignant Neoplasms (Cancer: C00-C97)          |               96|"
 [9] "|Indoor Air Quality |                81277|Influenza (Flu) and Pneumonia (J09-J18)        |               96|"
[10] "|Indoor Air Quality |                81277|Influenza (Flu) and Pneumonia (J09-J18)        |               96|"
[11] "|Asbestos           |                 8070|Malignant Neoplasms (Cancer: C00-C97)          |               96|"
[12] "|Asbestos           |                 8070|Malignant Neoplasms (Cancer: C00-C97)          |               96|"
[13] "|Mold               |                 5184|Chronic Lower Respiratory Diseases (J40-J47)   |               88|"
[14] "|Indoor Air Quality |                81277|Influenza (Flu) and Pneumonia (J09-J18)        |               96|"
[15] "|Asbestos           |                 8070|Malignant Neoplasms (Cancer: C00-C97)          |               96|"
I was able to merge the data sets together with the mapping table that I created to pair complaints with the 5 causes of death that I chose. After I merged the data sets, I filtered out the NAs that were in some of the columns to make it easier to run statistical tests.
1.9 Corrleation between causes of death and indoor environmental complaints
Show the code
death_causes_complaint_cor<-cor(death_and_complaints$`Number of Complaints`, death_and_complaints$`Number of Deaths`)death_causes_complaint_cor
[1] 0.6122905
I ran a correlation test to examine if there was a relationship between the number of indoor environmental complaint types and the 5 leading causes of death that I chose to work with. After running the test, we get an r of 0.6122905, which conveys that there is a moderately positive relationship between the number of complaints and causes of death.
However, it is important to note that the merged data set has multiple repeated rows for each complaint type and cause of death. Due to this, the correlation may not be fully accurate.
1.10 Linear Regression
Show the code
lm_death_and_complaints<-lm(`Number of Deaths`~`Number of Complaints`+ cause_of_death, data=death_and_complaints)lm_death_and_complaints
Call:
lm(formula = `Number of Deaths` ~ `Number of Complaints` + cause_of_death,
    data = death_and_complaints)

Coefficients:
                                                 (Intercept)
                                                   9.000e+01
                                      `Number of Complaints`
                                                  -2.305e-17
  cause_of_deathChronic Lower Respiratory Diseases (J40-J47)
                                                  -2.000e+00
cause_of_deathDiseases of Heart (I00-I09, I11, I13, I20-I51)
                                                   6.000e+00
       cause_of_deathInfluenza (Flu) and Pneumonia (J09-J18)
                                                   6.000e+00
         cause_of_deathMalignant Neoplasms (Cancer: C00-C97)
                                                   6.000e+00
I created a linear regression to examine if the number of indoor environmental complaints could predict the amount of deaths for different causes of death. The linear regression shows that number of complaints is not a predicting factor for causes of death, and that the differences in the different leading causes of death is more due to the actual cause of death. Although I did not find a promising predicting effect, this linear regression helped to show us that there may not be a relationship with indoor environmental complaints and leading causes of death. Overall, the differences in number of deaths are more explained by the cause of death (e.g., heart diseases, chronic lower respiratory diseases, etc.)
Once again, the merged data has repetitions in both the complaint type column and the cause of death column, so the results from this linear regression model should not be strongly interpreted.
1.11 Relevance and Conclusion
This topic is important to the general community because it shed light to indoor environmental hazards that individuals file complaints about. It also sheds a little light on the leading causes of death and could make people wonder if there is a relationship between indoor environmental hazards and leading causes of death in NYC. From analyzing our data a little bit, we were able to see that Indoor Air quality was the most complained about over the last 15 years. That is very important to know because it is a problem that doesn’t seem to have been getting better over the years, meaning that it needs to be brought to the public’s attention and reach policy makers to show them that it is a ongoing problem/complaint and something needs to be done about it. I chose to look at 5 leading causes of death out of the 26 causes that were provided in this data set. The reason I did this was to look at some of the more common and possibly well known (compared to other) causes and try to see if there could possibly be a relationship between the different complaint types and those 5 causes of death. Once again, to note, I paired the causes of death with the complaint type myself, meaning that it is not a solid fact that there is causation among this analysis.