Show the code
library(tidyverse)
library(readxl)
library(ggplot2)
library(mosaic)
library(AICcmodavg)
library(knitr)
library(arrow)Housing conditions are an important factor in public health and well-being. Poor residential environments, such as mold exposure, can contribute to physical health problems and increased stress. Domestic violence is also influenced by environmental and social stressors, making housing conditions a relevant area of study.
This project examines the relationship between residential mold complaints and domestic violence reports in New York City from 2010 to 2024. I am using two datasets from NYC Open Data: 311 Complaint Data to extract residential mold complaints and NYPD Complaint Data Historic to extract domestic violence reports. Using NYC 311 mold complaint data and DV report data, I explore whether these two types of reports follow similar patterns over time. The goal is not to determine causation, but to understand whether mold complaints and DV reports tend to rise and fall together.
The analysis focuses on monthly aggregated data and includes exploratory summaries, correlation analyses, and regression models. I also explore delayed (or lagged) relationships and mold complaint resolution time to better understand how timing may play a role.
library(tidyverse)
library(readxl)
library(ggplot2)
library(mosaic)
library(AICcmodavg)
library(knitr)
library(arrow)mold_data <- read_parquet("311_Service_Requests_from_2010_to_Present_20251215.parquet")
dv_data <- read_parquet("NYPD_Complaint_Data_Historic_20251218.parquet")# 1. Create a Lookup Table for the Cities (The "Max Squeeze" approach)
# This replaces the 100-line case_when and is much faster/stable
city_lookup <- data.frame(
City = c("NEW YORK", "BROOKLYN", "ARVERNE", "BRONX", "JAMAICA", "STATEN ISLAND",
"SPRINGFIELD GARDENS", "FLUSHING", "RICHMOND HILL", "ASTORIA", "HOLLIS",
"RIDGEWOOD", "FOREST HILLS", "ELMHURST", "MASPETH", "SOUTH RICHMOND HILL",
"JACKSON HEIGHTS", "BAYSIDE", "FAR ROCKAWAY", "SAINT ALBANS", "CORONA",
"WOODSIDE", "QUEENS VILLAGE", "REGO PARK", "ROSEDALE", "SUNNYSIDE",
"OZONE PARK", "EAST ELMHURST", "MIDDLE VILLAGE", "WOODHAVEN",
"SOUTH OZONE PARK", "ROCKAWAY PARK", "KEW GARDENS", "FRESH MEADOWS",
"COLLEGE POINT", "LONG ISLAND CITY", "OAKLAND GARDENS", "WHITESTONE",
"HOWARD BEACH", "CAMBRIA HEIGHTS", "BELLEROSE", "LITTLE NECK",
"BREEZY POINT", "GLEN OAKS", "FLORAL PARK", "PELHAM", "NEW HYDE PARK",
"QUEENS", "MANHATTAN"),
Borough_Mapped = c("MANHATTAN", "BROOKLYN", "QUEENS", "BRONX", "QUEENS", "STATEN ISLAND",
"QUEENS", "QUEENS", "QUEENS", "QUEENS", "QUEENS",
"QUEENS", "QUEENS", "QUEENS", "QUEENS", "QUEENS",
"QUEENS", "QUEENS", "QUEENS", "QUEENS", "QUEENS",
"QUEENS", "QUEENS", "QUEENS", "QUEENS", "QUEENS",
"QUEENS", "QUEENS", "QUEENS", "QUEENS",
"QUEENS", "QUEENS", "QUEENS", "QUEENS",
"QUEENS", "QUEENS", "QUEENS", "QUEENS",
"QUEENS", "QUEENS", "QUEENS", "QUEENS",
"QUEENS", "QUEENS", "QUEENS", "BRONX", "QUEENS",
"QUEENS", "MANHATTAN")
)
# 2. Process Mold Data
mold_data_clean <- mold_data %>%
# Filter Location Types efficiently
filter(`Location Type` %in% c("RESIDENTIAL BUILDING", "Residential Building", "Loft Residence",
"Mixed Use Building", "Apartment", "3+ Family Apartment Building",
"1-2 Family Dwelling", "1-2 Family Mixed Use Building",
"3+ Family Mixed Use Building", "Single Room Occupancy (SRO)")) %>%
filter(Descriptor != "Unsafe Mold Cleanup") %>%
mutate(
created_date = as.Date(`Created Date`),
closed_date = as.Date(`Closed Date`),
# Force Year to numeric to prevent Join errors
Year = as.numeric(lubridate::year(created_date)),
# Clean Month formatting
Month = sprintf("%02d - %s",
lubridate::month(created_date),
lubridate::month(created_date, label = TRUE, abbr = FALSE)),
resolution_days = as.numeric(closed_date - created_date),
`Complaint Type` = case_when(
`Complaint Type` %in% c("UNSANITARY CONDITION", "Unsanitary Condition", "MOLD", "GENERAL", "GENERAL CONSTRUCTION") ~ "Mold",
TRUE ~ `Complaint Type`
)
) %>%
# Use the lookup table for City -> Borough
left_join(city_lookup, by = "City") %>%
mutate(Borough = coalesce(Borough_Mapped, "UNKNOWN")) %>%
filter(Borough != "UNKNOWN", Year != 2025)
# 3. Process DV Data
dv_data_clean <- dv_data %>%
rename(
"complaint_number" = `CMPLNT_NUM`,
"inc_occur_date" = `CMPLNT_FR_DT`,
"inc_occur_time" = `CMPLNT_FR_TM`,
"inc_end_date" = `CMPLNT_TO_DT`,
"inc_end_time" = `CMPLNT_TO_TM`,
"precinct_occur" = `ADDR_PCT_CD`,
"report_date" = `RPT_DT`,
"key_code" = `KY_CD`,
"offense_type" = `OFNS_DESC`,
"class_code" = `PD_CD`,
"class_code_desc" = `PD_DESC`,
"attempt_completion" = `CRM_ATPT_CPTD_CD`,
"offense_level" = `LAW_CAT_CD`,
"borough" = `BORO_NM`,
"suspect_age" = `SUSP_AGE_GROUP`,
"suspect_race" = `SUSP_RACE`,
"suspect_sex" = `SUSP_SEX`,
"victim_age" = `VIC_AGE_GROUP`,
"victim_race" = `VIC_RACE`,
"victim_sex" = `VIC_SEX`
) %>%
mutate(
inc_date_converted = as.Date(inc_occur_date),
# Force Year to numeric to match Mold data
Year = as.numeric(lubridate::year(inc_date_converted)),
Month = sprintf("%02d - %s",
lubridate::month(inc_date_converted),
lubridate::month(inc_date_converted, label = TRUE, abbr = FALSE)),
complaint = "DV"
) %>%
filter(Year >= 2010 & Year < 2025)
mold_data_clean <- mold_data_clean %>% mutate(Year = as.character(Year))
dv_data_clean <- dv_data_clean %>% mutate(Year = as.character(Year))
# 4. Final memory cleanup (optional but helpful for cloud publishing)
rm(mold_data, dv_data)kable(head(mold_data_clean, 3),
caption = "Preview of cleaned 311 residential mold complaints (first 3 rows) after filtering to residential location types and creating date/resolution fields.")| Unique Key | Created Date | Closed Date | Agency | Agency Name | Complaint Type | Descriptor | Location Type | Incident Zip | Incident Address | Street Name | Cross Street 1 | Cross Street 2 | Intersection Street 1 | Intersection Street 2 | Address Type | City | Landmark | Facility Type | Status | Due Date | Resolution Description | Resolution Action Updated Date | Community Board | BBL | Borough | X Coordinate (State Plane) | Y Coordinate (State Plane) | Open Data Channel Type | Park Facility Name | Park Borough | Vehicle Type | Taxi Company Borough | Taxi Pick Up Location | Bridge Highway Name | Bridge Highway Direction | Road Ramp | Bridge Highway Segment | Latitude | Longitude | Location | created_date | closed_date | Year | Month | resolution_days | Borough_Mapped |
|---|---|---|---|---|---|---|---|---|---|---|---|---|---|---|---|---|---|---|---|---|---|---|---|---|---|---|---|---|---|---|---|---|---|---|---|---|---|---|---|---|---|---|---|---|---|---|
| 63573695 | 2024-12-31T23:06:14.000 | 2025-01-19T11:58:36.000 | HPD | Department of Housing Preservation and Development | Mold | MOLD | RESIDENTIAL BUILDING | 10451 | 283 EAST 149 STREET | EAST 149 STREET | NA | NA | NA | NA | ADDRESS | BRONX | NA | NA | Closed | NA | HPD conducted an inspection of this complaint. The conditions observed by the inspector did not violate the housing laws enforced by HPD. The complaint has been closed. | 2025-01-19T00:00:00.000 | 01 BRONX | 2023310072 | BRONX | 1005910 | 236991 | PHONE | Unspecified | BRONX | NA | NA | NA | NA | NA | NA | NA | 40.81713 | -73.92175 | (40.81713468822815, -73.9217467475281) | 2024-12-31 | 2025-01-19 | 2024 | 12 - December | 19 | BRONX |
| 63583460 | 2024-12-31T21:19:39.000 | 2025-01-03T16:24:36.000 | HPD | Department of Housing Preservation and Development | Mold | MOLD | RESIDENTIAL BUILDING | 10468 | 2719 MORRIS AVENUE | MORRIS AVENUE | NA | NA | NA | NA | ADDRESS | BRONX | NA | NA | Closed | NA | HPD inspected this condition so the complaint has been closed. Violations were issued. The law provides the property owner time to correct the condition(s). Violation descriptions and the dates for the property owner to correct any violations are available at HPDONLINE. If the owner has not corrected the condition by the date provided, you may wish to bring a case in housing court seeking the correction of these conditions.To find out more about how to start a housing court case, visit HPD’s w | 2025-01-03T00:00:00.000 | 07 BRONX | 2033170043 | BRONX | 1013153 | 255563 | PHONE | Unspecified | BRONX | NA | NA | NA | NA | NA | NA | NA | 40.86809 | -73.89550 | (40.86808863174485, -73.89549921281306) | 2024-12-31 | 2025-01-03 | 2024 | 12 - December | 3 | BRONX |
| 63583408 | 2024-12-31T20:55:28.000 | 2025-01-10T16:55:45.000 | HPD | Department of Housing Preservation and Development | Mold | MOLD | RESIDENTIAL BUILDING | 11435 | 85-15 139 STREET | 139 STREET | NA | NA | NA | NA | ADDRESS | JAMAICA | NA | NA | Closed | NA | HPD conducted an inspection of this complaint. The conditions observed by the inspector did not violate the housing laws enforced by HPD. The complaint has been closed. | 2025-01-10T00:00:00.000 | 08 QUEENS | 4097100002 | QUEENS | 1034989 | 197495 | PHONE | Unspecified | QUEENS | NA | NA | NA | NA | NA | NA | NA | 40.70861 | -73.81699 | (40.7086094282564, -73.8169884642595) | 2024-12-31 | 2025-01-10 | 2024 | 12 - December | 10 | QUEENS |
kable(head(dv_data_clean, 5),
caption = "Preview of cleaned NYPD complaint records used to identify domestic violence reports (first 5 rows) after renaming fields and extracting date components.")| complaint_number | inc_occur_date | inc_occur_time | inc_end_date | inc_end_time | precinct_occur | report_date | key_code | offense_type | class_code | class_code_desc | attempt_completion | offense_level | borough | LOC_OF_OCCUR_DESC | PREM_TYP_DESC | JURIS_DESC | JURISDICTION_CODE | PARKS_NM | HADEVELOPT | HOUSING_PSA | X_COORD_CD | Y_COORD_CD | suspect_age | suspect_race | suspect_sex | TRANSIT_DISTRICT | Latitude | Longitude | Lat_Lon | PATROL_BORO | STATION_NAME | victim_age | victim_race | victim_sex | inc_date_converted | Year | Month | complaint |
|---|---|---|---|---|---|---|---|---|---|---|---|---|---|---|---|---|---|---|---|---|---|---|---|---|---|---|---|---|---|---|---|---|---|---|---|---|---|---|
| 298690828 | 2024-12-31T00:00:00.000 | 13:00:00 | 2024-12-31T00:00:00.000 | 13:10:00 | 113 | 2024-12-31T00:00:00.000 | 344 | ASSAULT 3 & RELATED OFFENSES | 101 | ASSAULT 3 | COMPLETED | MISDEMEANOR | QUEENS | INSIDE | RESIDENCE-HOUSE | N.Y. POLICE DEPT | 0 | (null) | (null) | NA | 1046104 | 187464 | <18 | BLACK | F | NA | 40.68101 | -73.77699 | (40.681014, -73.776991) | PATROL BORO QUEENS SOUTH | (null) | <18 | BLACK | M | 2024-12-31 | 2024 | 12 - December | DV |
| 298698016 | 2024-12-31T00:00:00.000 | 08:00:00 | 2024-12-31T00:00:00.000 | 09:00:00 | 116 | 2024-12-31T00:00:00.000 | 344 | ASSAULT 3 & RELATED OFFENSES | 101 | ASSAULT 3 | COMPLETED | MISDEMEANOR | QUEENS | INSIDE | RESIDENCE-HOUSE | N.Y. POLICE DEPT | 0 | (null) | (null) | NA | 1048028 | 178970 | 25-44 | BLACK | M | NA | 40.65769 | -73.77013 | (40.657687, -73.770132) | PATROL BORO QUEENS SOUTH | (null) | 18-24 | WHITE HISPANIC | F | 2024-12-31 | 2024 | 12 - December | DV |
| 298704508 | 2024-12-31T00:00:00.000 | 16:50:00 | 2024-12-31T00:00:00.000 | 16:56:00 | 107 | 2024-12-31T00:00:00.000 | 344 | ASSAULT 3 & RELATED OFFENSES | 101 | ASSAULT 3 | COMPLETED | MISDEMEANOR | QUEENS | INSIDE | RESIDENCE - APT. HOUSE | N.Y. POLICE DEPT | 0 | (null) | (null) | NA | 1050645 | 203097 | UNKNOWN | BLACK | F | NA | 40.72389 | -73.76046 | (40.723891, -73.760464) | PATROL BORO QUEENS SOUTH | (null) | 65+ | WHITE | M | 2024-12-31 | 2024 | 12 - December | DV |
| 298678676 | 2024-12-31T00:00:00.000 | 07:00:00 | 2024-12-31T00:00:00.000 | 07:30:00 | 113 | 2024-12-31T00:00:00.000 | 344 | ASSAULT 3 & RELATED OFFENSES | 101 | ASSAULT 3 | COMPLETED | MISDEMEANOR | QUEENS | INSIDE | RESIDENCE-HOUSE | N.Y. POLICE DEPT | 0 | (null) | (null) | NA | 1051478 | 189936 | 25-44 | BLACK | M | NA | 40.68776 | -73.75759 | (40.687762, -73.757589) | PATROL BORO QUEENS SOUTH | (null) | 45-64 | BLACK | M | 2024-12-31 | 2024 | 12 - December | DV |
| 298672417 | 2024-12-31T00:00:00.000 | 02:50:00 | 2024-12-31T00:00:00.000 | 02:55:00 | 101 | 2024-12-31T00:00:00.000 | 344 | ASSAULT 3 & RELATED OFFENSES | 101 | ASSAULT 3 | COMPLETED | MISDEMEANOR | QUEENS | INSIDE | RESIDENCE-HOUSE | N.Y. POLICE DEPT | 0 | (null) | (null) | NA | 1054075 | 157436 | 45-64 | BLACK | M | NA | 40.59854 | -73.74856 | (40.598536, -73.74856) | PATROL BORO QUEENS SOUTH | (null) | 45-64 | BLACK | F | 2024-12-31 | 2024 | 12 - December | DV |
This chunk deals with some heavy cleaning of large datasets; I am mostly standardizing column names, values, filling in NA values for Borough (using the City column), and getting rid of otherwise NA values. I also separated the dates so that Year, Month, and Day could be individually utilized in the project.
aggregated_dv_data <- dv_data_clean %>%
  group_by(Year, Month, borough) %>%
  summarise(
    `complaint` = n(),
    .groups = "drop"
  )
aggregated_dv_data <- aggregated_dv_data %>%
  filter(borough != "(null)")

aggregated_dv_data <- aggregated_dv_data %>%
  mutate(Year = as.character(Year))

aggregated_dv_data<- aggregated_dv_data %>% rename(
  "Borough" = "borough")

aggregated_dv_data<- aggregated_dv_data %>% rename(
  "DV Reports" = "complaint"
)

aggregated_mold_data <- mold_data_clean %>%
  group_by(Year, Month, Borough) %>%
  summarise(
  `Complaint Type` = n(),
  .groups = "drop"
)

aggregated_mold_data<- aggregated_mold_data %>% rename(
  "Mold Complaints" = "Complaint Type"
)

aggregated_dv_mold_data <- left_join(
  aggregated_dv_data,
  aggregated_mold_data,
  by = c("Borough", "Year", "Month")
)

aggregated_dv_mold_data <- aggregated_dv_mold_data %>%
  mutate(
    year_month = paste(Year, Month)
  )

aggregated_dv_mold_data <- aggregated_dv_mold_data %>%
  group_by(Borough) %>%
  mutate(time_index = row_number()) %>%
  ungroup()

kable(head(aggregated_dv_mold_data, 15),
caption = "Monthly borough-level dataset combining domestic violence report counts and residential mold complaint counts (first 15 rows).")| Year | Month | Borough | DV Reports | Mold Complaints | year_month | time_index |
|---|---|---|---|---|---|---|
| 2010 | 01 - January | BRONX | 910 | 954 | 2010 01 - January | 1 |
| 2010 | 01 - January | BROOKLYN | 1306 | 779 | 2010 01 - January | 1 |
| 2010 | 01 - January | MANHATTAN | 541 | 410 | 2010 01 - January | 1 |
| 2010 | 01 - January | QUEENS | 791 | 315 | 2010 01 - January | 1 |
| 2010 | 01 - January | STATEN ISLAND | 154 | 58 | 2010 01 - January | 1 |
| 2010 | 02 - February | BRONX | 818 | 738 | 2010 02 - February | 2 |
| 2010 | 02 - February | BROOKLYN | 938 | 651 | 2010 02 - February | 2 |
| 2010 | 02 - February | MANHATTAN | 424 | 338 | 2010 02 - February | 2 |
| 2010 | 02 - February | QUEENS | 603 | 273 | 2010 02 - February | 2 |
| 2010 | 02 - February | STATEN ISLAND | 151 | 29 | 2010 02 - February | 2 |
| 2010 | 03 - March | BRONX | 969 | 941 | 2010 03 - March | 3 |
| 2010 | 03 - March | BROOKLYN | 1149 | 870 | 2010 03 - March | 3 |
| 2010 | 03 - March | MANHATTAN | 500 | 415 | 2010 03 - March | 3 |
| 2010 | 03 - March | QUEENS | 758 | 395 | 2010 03 - March | 3 |
| 2010 | 03 - March | STATEN ISLAND | 147 | 55 | 2010 03 - March | 3 |
In this chunk, I aggregated the domestic violence reports and mold complaints datasets into one, grouped by month and borough, in order to easily analyze trends.
dv_summary <- aggregated_dv_data %>%
  summarise(
    total_reports = sum(`DV Reports`),
    start_year = min(as.numeric(Year)),
    end_year = max(as.numeric(Year)),
    boroughs = n_distinct(Borough),
    avg_monthly = mean(`DV Reports`)
  )

kable(dv_summary,
caption = "Summary of domestic violence reports in NYC (2010–2024), aggregated from NYPD complaint data.")| total_reports | start_year | end_year | boroughs | avg_monthly |
|---|---|---|---|---|
| 669136 | 2010 | 2024 | 5 | 743.4844 |
From the beginning of the year in 2010 to the end of the year in 2024, there were a total of 669,136 domestic violence incidents reported across all five boroughs in New York City. Without grouping by year or borough, there are roughly 743 domestic violence incident reports filed each month.
dv_by_year_borough <- aggregated_dv_data %>%
  group_by(Year, Borough) %>%
  summarise(total_reports = sum(`DV Reports`)) %>%
  pivot_wider(names_from = Year,
    values_from = total_reports)

kable(dv_by_year_borough,
caption = "Total domestic violence reports by borough and year (2010–2024).")| Borough | 2010 | 2011 | 2012 | 2013 | 2014 | 2015 | 2016 | 2017 | 2018 | 2019 | 2020 | 2021 | 2022 | 2023 | 2024 |
|---|---|---|---|---|---|---|---|---|---|---|---|---|---|---|---|
| BRONX | 11274 | 11441 | 12207 | 12630 | 12924 | 12594 | 12916 | 12569 | 13662 | 12943 | 12013 | 12499 | 14193 | 14149 | 14905 |
| BROOKLYN | 14094 | 14344 | 15232 | 15032 | 15022 | 14101 | 13771 | 13052 | 13039 | 12250 | 11256 | 12362 | 13286 | 13180 | 13652 |
| MANHATTAN | 6081 | 6128 | 6471 | 6409 | 6627 | 6555 | 6791 | 6586 | 6550 | 6864 | 6117 | 7160 | 7194 | 6880 | 7215 |
| QUEENS | 8726 | 9182 | 9128 | 9425 | 9467 | 8906 | 8697 | 8733 | 9047 | 9324 | 8778 | 9368 | 10205 | 10484 | 12071 |
| STATEN ISLAND | 2015 | 2056 | 2414 | 2242 | 2364 | 2178 | 2112 | 2036 | 2048 | 1868 | 1687 | 1871 | 2099 | 2126 | 2259 |
From 2010 to 2024, Brooklyn and Bronx have consistently had the highest amount of domestic violence reports in NYC. Brooklyn was the borough with the most amount of reports since 2010, but sometime in 2018, Bronx took the title for highest reported incidents and has been the borough with the highest number of reports since then. Staten Island has had the lowest reported incidents each year.
For the most part, domestic violence incident reports have risen across the boroughs consistently from 2010-2024. However, Brooklyn is the only borough in which the number of reported incidents are lower in 2024 than they were in 2010. (This could be something interesting to look into!)
library(ggplot2)

dv_plot_data <- aggregated_dv_data %>%
  group_by(Year, Borough) %>%
  summarise(total_reports = sum(`DV Reports`))

ggplot(dv_plot_data, aes(x = Year, y = Borough, fill = total_reports)) +
  geom_tile(color = "white") +
  scale_fill_gradient(low = "lightblue", high = "darkred") +
  labs(
    title = "DV Reports by Borough and Year",
    x = "Year",
    y = "Borough",
    fill = "DV Reports"
  ) +
  theme_minimal() +
  theme(axis.text.x = element_text(angle = 45))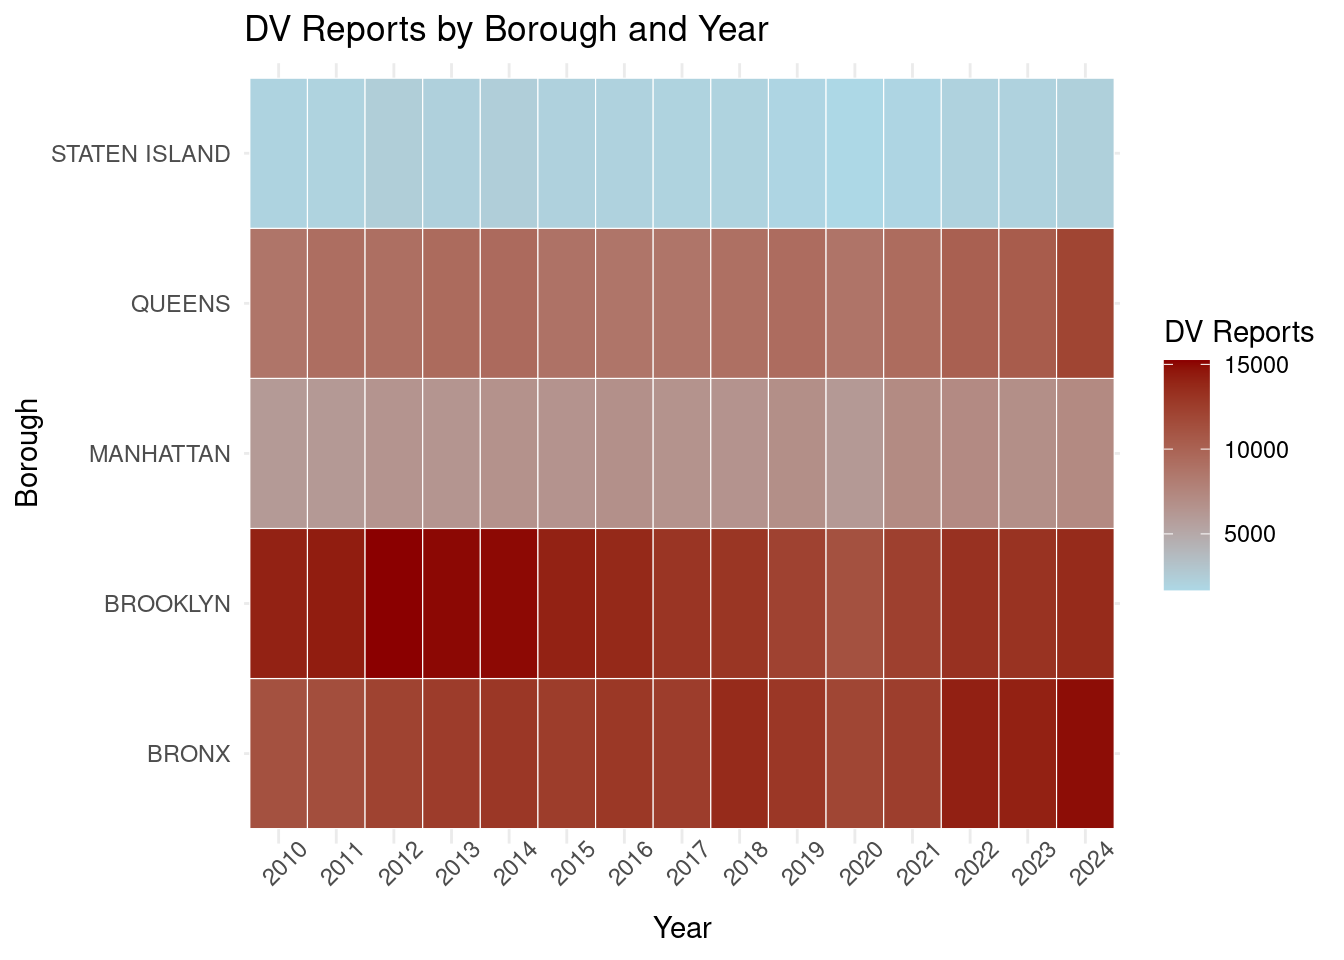
Above is a heat map of domestic violence incident reports from 2010-2024. This reflects what was observed in the previous table; The Bronx and Brooklyn typically tend to have a higher volume of reports, and Staten Island has stayed largely below the average.
mold_summary <- aggregated_mold_data %>%
  summarise(
    total_complaints = sum(`Mold Complaints`),
    start_year = min(as.numeric(Year)),
    end_year = max(as.numeric(Year)),
    boroughs = n_distinct(Borough),
    avg_monthly = mean(`Mold Complaints`)
  )

kable(mold_summary,
caption = "Summary of residential mold complaints in NYC (2010–2024), aggregated from 311 service requests.")| total_complaints | start_year | end_year | boroughs | avg_monthly |
|---|---|---|---|---|
| 361603 | 2010 | 2024 | 5 | 445.3239 |
From 2010-2025, there have been a total of 412,698 mold complaints in residential buildings reported across all five boroughs in New York City. Without grouping by year or borough, there are roughly 431 residential mold complaints made to 311 every month.
mold_by_year_borough <- aggregated_mold_data %>%
  group_by(Year, Borough) %>%
  summarise(total_complaints = sum(`Mold Complaints`)) %>%
  pivot_wider(names_from = Year,
    values_from = total_complaints)

kable(mold_by_year_borough,
caption = "Total residential mold complaints by borough and year (2010–2024).")| Borough | 2010 | 2011 | 2012 | 2013 | 2014 | 2015 | 2016 | 2017 | 2018 | 2019 | 2020 | 2021 | 2022 | 2023 | 2024 |
|---|---|---|---|---|---|---|---|---|---|---|---|---|---|---|---|
| BRONX | 7973 | 8726 | 7384 | 7778 | 8295 | 8434 | 7946 | 7510 | 9510 | 6460 | 5953 | 9378 | 9513 | 11438 | 12847 |
| BROOKLYN | 8244 | 10404 | 8373 | 9299 | 9280 | 9074 | 7700 | 7908 | 9747 | 6360 | 5397 | 8199 | 8265 | 10389 | 11092 |
| MANHATTAN | 3977 | 4403 | 3683 | 3840 | 4787 | 5062 | 4395 | 4031 | 4942 | 3119 | 2985 | 5027 | 5347 | 6660 | 6757 |
| QUEENS | 3258 | 3907 | 2414 | 2 | NA | 2 | 3 | 1 | 3 | 12 | 1 | 872 | 3347 | 4229 | 4736 |
| STATEN ISLAND | 615 | 852 | 730 | 757 | 747 | 688 | 720 | 691 | 864 | 529 | 504 | 777 | 721 | 960 | 770 |
From 2010 to 2024, Brooklyn and Bronx seem to have the highest complaints of mold in residential buildings, and they compete for first place. Staten Island was found to have the lowest number of residential mold complaints to 311 each year.
Across all 5 boroughs, there are more mold complaints in 2024 than there were in 2010, with the overall trend being an increase in 311 complaints for residential mold.
mold_plot_data <- aggregated_mold_data %>%
  group_by(Year, Borough) %>%
  summarise(total_complaints = sum(`Mold Complaints`))

ggplot(mold_plot_data, aes(x = Year, y = Borough, fill = total_complaints)) +
  geom_tile(color = "white") +
  scale_fill_gradient(low = "wheat", high = "darkgreen") +
  labs(
    title = "Mold Complaints by Borough and Year",
    x = "Year",
    y = "Borough",
    fill = "Mold Complaints"
  ) +
  theme_minimal() +
  theme(axis.text.x = element_text(angle = 45))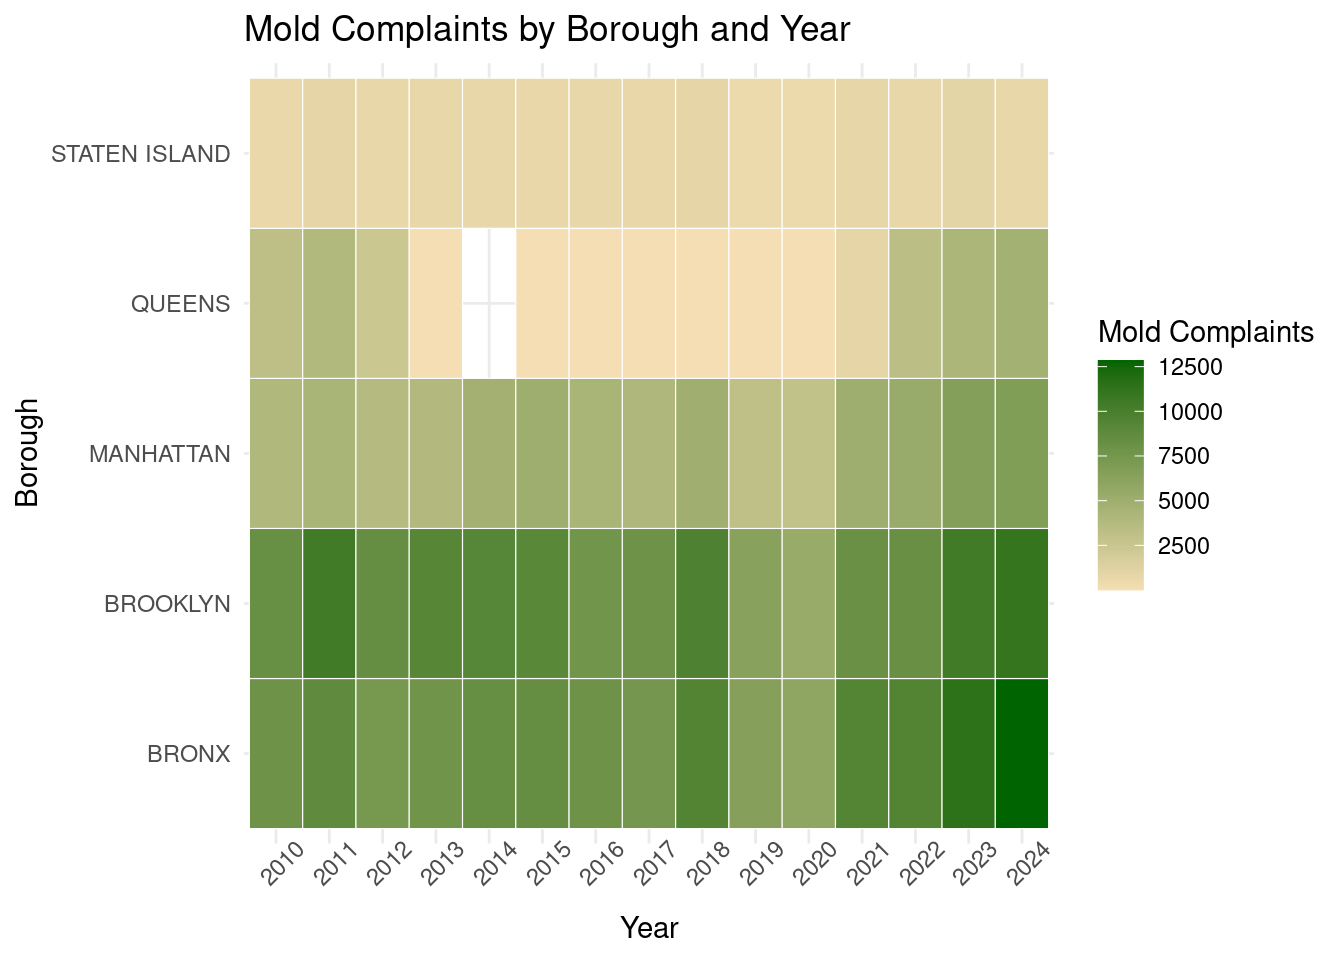
Above is a heat map of residential mold complaints to 311 from 2010-2025. Similar in density to the domestic violence report heat map; The Bronx and Brooklyn seem to have a higher volume of complaints, and Staten Island has stayed largely below the average.
cor.test(aggregated_dv_mold_data$`DV Reports`,
         aggregated_dv_mold_data$`Mold Complaints`)
    Pearson's product-moment correlation

data:  x and y
t = 42.034, df = 810, p-value < 2.2e-16
alternative hypothesis: true correlation is not equal to 0
95 percent confidence interval:
 0.8051174 0.8485104
sample estimates:
      cor
0.8280499
Strength: 0.82 (very strong)
Direction: positive
Significance: statistically significant (p<0.05)
I ran a correlation between domestic violence reports and residential mold complaints to see if there was a substantial relationship between them, and there is! The relationship between the two is positive and very strong, suggesting that a higher amount of DV reports is associated with a higher amount of mold complaints, and a lower number of DV reports is associated with a lower amount of mold complaints. This tells us that both variables move together.
ggplot(aggregated_dv_mold_data, aes(x = `Mold Complaints`, y = `DV Reports`, color = Borough)) +
  geom_point(alpha = 0.5) +
  geom_smooth(method = "lm", se = FALSE, color = "gray18") +
  labs(title = "DV Reports vs Mold Complaints by Borough",
       x = "Mold Complaints",
       y = "DV Reports") +
  theme_minimal()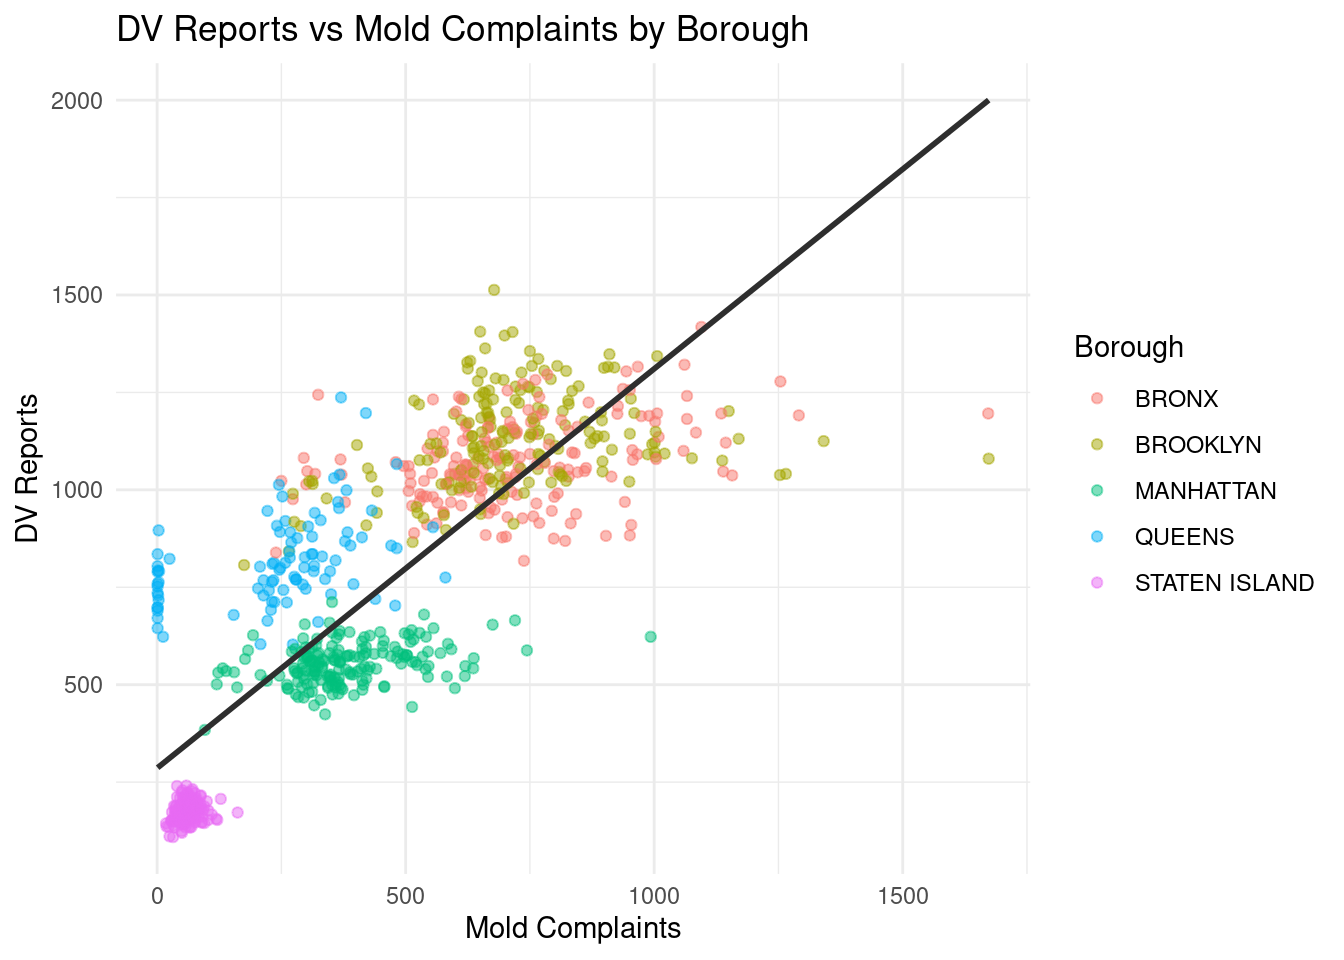
However, this only tells us that domestic violence reports and mold complaints co-occur, and it does not tell us anything about causality.
Let’s dive into how domestic violence reports and mold complaints develop over time!
yearly_counts_wide <- aggregated_dv_mold_data %>%
  group_by(Year) %>%
  summarise(
    `DV Reports` = sum(`DV Reports`, na.rm = TRUE),
    `Mold Complaints` = sum(`Mold Complaints`, na.rm = TRUE),
    .groups = "drop"
  ) %>%
  pivot_longer(
    cols = c(`DV Reports`, `Mold Complaints`),
    names_to = "Type",
    values_to = "Count"
  ) %>%
  pivot_wider(
    names_from = Year,
    values_from = Count
  )

kable(yearly_counts_wide,
caption = "Citywide totals by year for domestic violence reports and residential mold complaints (2010–2024).")| Type | 2010 | 2011 | 2012 | 2013 | 2014 | 2015 | 2016 | 2017 | 2018 | 2019 | 2020 | 2021 | 2022 | 2023 | 2024 |
|---|---|---|---|---|---|---|---|---|---|---|---|---|---|---|---|
| DV Reports | 42190 | 43151 | 45452 | 45738 | 46404 | 44334 | 44287 | 42976 | 44346 | 43249 | 39851 | 43260 | 46977 | 46819 | 50102 |
| Mold Complaints | 24067 | 28292 | 22584 | 21676 | 23109 | 23260 | 20764 | 20141 | 25066 | 16480 | 14840 | 24253 | 27193 | 33676 | 36202 |
Looking at this table, we can see that DV reports and mold complaints have staggered over the years, but overall they seem to have an increasing trend. Both variables have higher reports in 2024 than they did in 2010.
monthly_counts <- aggregated_dv_mold_data %>%
  group_by(Year, Month) %>%
  summarise(
    total_dv = sum(`DV Reports`, na.rm = TRUE),
    total_mold = sum(`Mold Complaints`, na.rm = TRUE)
  )

kable(head(monthly_counts, 12),
caption = "First 12 rows of citywide monthly totals for domestic violence reports and residential mold complaints (2010–2024).")| Year | Month | total_dv | total_mold |
|---|---|---|---|
| 2010 | 01 - January | 3702 | 2516 |
| 2010 | 02 - February | 2934 | 2029 |
| 2010 | 03 - March | 3523 | 2676 |
| 2010 | 04 - April | 3343 | 2251 |
| 2010 | 05 - May | 3583 | 1787 |
| 2010 | 06 - June | 3867 | 1856 |
| 2010 | 07 - July | 3872 | 1765 |
| 2010 | 08 - August | 3617 | 1958 |
| 2010 | 09 - September | 3618 | 1766 |
| 2010 | 10 - October | 3542 | 1969 |
| 2010 | 11 - November | 3365 | 1661 |
| 2010 | 12 - December | 3224 | 1833 |
Above is a table that separates the total domestic violence reports and mold complaints by each month per year. If we plot this, we can see how they both trend over time compared to one another:
plot_data <- aggregated_dv_mold_data %>%
  pivot_longer(
    cols = c(`DV Reports`, `Mold Complaints`),
    names_to = "Type",
    values_to = "Count"
  )

ggplot(plot_data, aes(x = time_index, y = Count, color = Type)) +
  geom_line(linewidth = 0.5) +
  facet_wrap(~Borough) +
  scale_color_manual(values = c("DV Reports" = "darkred", "Mold Complaints" = "darkgreen")) +
  labs(
    title = "Monthly DV and Mold Reports by Borough",
    x = "Time",
    y = "Number of Reports",
    color = "Report Type"
  ) +
  theme_minimal() +
  theme(axis.text.x = element_text(angle = 45)
  )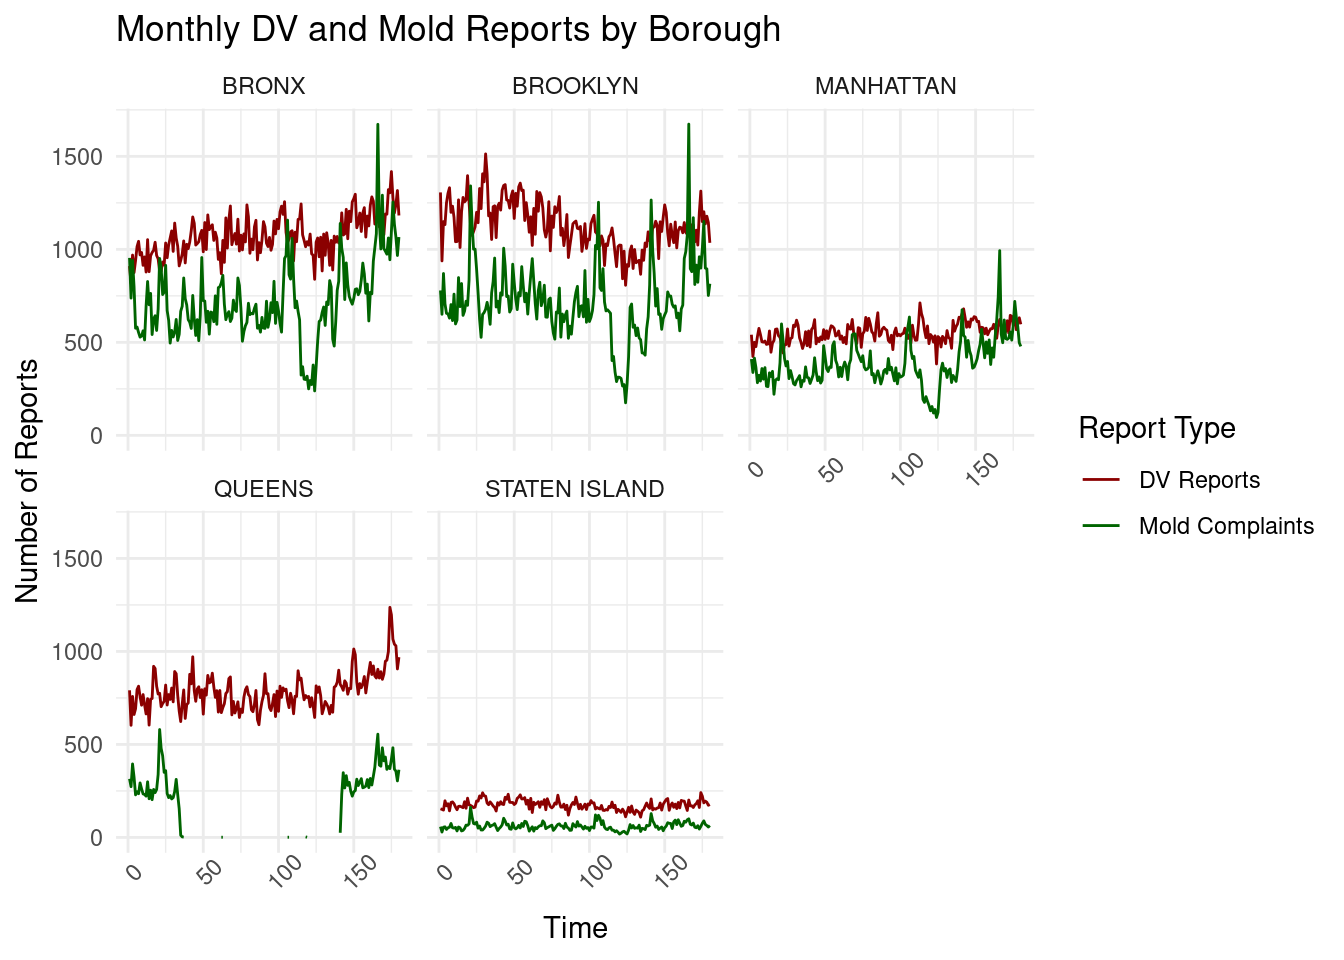
Here, we have line plots of domestic violence reports and residential mold complaints per month from January of 2010 to December of 2024 (faceted by borough). We can see similar peaks across the boroughs (especially The Bronx and Brooklyn).
So, how exactly does mold exposure relate to domestic violence reports over time?
We’ve established that a relationship exists between the two variables themselves, but we need to look closer at this data. How does domestic violence in a given borough during a given month correlate with mold complaints in the same borough during the same month, and how does those variables move together?
Month-by-Month DV vs. Mold Counts
cor.test(monthly_counts$total_dv, monthly_counts$total_mold)
    Pearson's product-moment correlation

data:  x and y
t = 5.5339, df = 178, p-value = 1.106e-07
alternative hypothesis: true correlation is not equal to 0
95 percent confidence interval:
 0.2509287 0.5013019
sample estimates:
      cor
0.3831305
Strength: 0.36
Direction: positive
Significance: statistically significant (p<0.05)
This is a much more realistic look at how mold complaints and DV reports move together across time! We got rid of borough size differences and were able to focus on the complaints and reports that were really happening in the same area during the same time. We can see that month-by-month DV reports and mold complaints have a moderate, positive correlation with one another and this result is statistically significant. This suggests that mold complaints and DV reports tend to coincide with each other each month.
Counts of mold complaints provide insight into the amount of housing issues that exist, but they do not tell us how long the residents are dealing with the exposure to mold. When investigating predictors of household stress, the length of time a complaint remains unresolved may be important.
So, let’s take a look at how resolution time may play a role in the relationship between domestic violence reports and mold complaints:
res_time<- mold_data_clean %>%
  group_by(Borough) %>%
  summarise(
    avg_resolution_days = mean(resolution_days, na.rm = TRUE),
    median_days = median(resolution_days, na.rm = TRUE),
    min_days = min(resolution_days, na.rm = TRUE),
    max_days = max(resolution_days, na.rm = TRUE),
    n_complaints = n()
  ) %>%
  arrange(desc(avg_resolution_days))

kable(res_time,
caption = "Residential mold complaint resolution time by borough (days between created and closed dates).")| Borough | avg_resolution_days | median_days | min_days | max_days | n_complaints |
|---|---|---|---|---|---|
| MANHATTAN | 20.60248 | 11 | 0 | 3090 | 69015 |
| STATEN ISLAND | 17.67769 | 11 | 0 | 805 | 10925 |
| QUEENS | 15.58721 | 8 | 0 | 4184 | 22787 |
| BRONX | 15.02155 | 10 | 0 | 975 | 129145 |
| BROOKLYN | 14.03738 | 9 | 0 | 3980 | 129731 |
Right away, we see a huge variation in the amount of days it has taken for a residential mold complaint to be resolved. Some reports are addressed as early as the same day, while others can take years to be fully resolved. The average amount of days it takes for a complaint to be resolved varies per borough, but it is roughly between 14 to 21 days, or 2 to 3 weeks.
mold_monthly_resolution <- mold_data_clean %>%
  group_by(Year, Month) %>%
  summarise(
    avg_resolution_days = mean(resolution_days, na.rm = TRUE),
    n_complaints = n()
  ) %>%
  arrange(Year, Month)

kable(head(mold_monthly_resolution, 12),
caption = "First 12 rows of monthly average mold-complaint resolution time (in days), with complaint volume.")| Year | Month | avg_resolution_days | n_complaints |
|---|---|---|---|
| 2010 | 01 - January | 20.31474 | 2516 |
| 2010 | 02 - February | 16.09571 | 2029 |
| 2010 | 03 - March | 15.59963 | 2676 |
| 2010 | 04 - April | 14.46246 | 2251 |
| 2010 | 05 - May | 14.81757 | 1787 |
| 2010 | 06 - June | 14.81358 | 1856 |
| 2010 | 07 - July | 14.59217 | 1765 |
| 2010 | 08 - August | 14.01535 | 1958 |
| 2010 | 09 - September | 13.32578 | 1766 |
| 2010 | 10 - October | 18.39756 | 1969 |
| 2010 | 11 - November | 20.97167 | 1661 |
| 2010 | 12 - December | 26.94590 | 1833 |
Above, we see the monthly average amount of days it took to resolve a mold complaint in 2010. This closely follows our averages from the previous table, with December as a bit of an outlier.
dv_mold_lagged <- aggregated_dv_mold_data %>%
  arrange(Borough, time_index) %>%
  group_by(Borough) %>%
  mutate(DV_next_month = lead(`DV Reports`, n = 1)) %>%
  ungroup()

kable(head(dv_mold_lagged, 12),
caption = "Lagged dataset preview: current-month mold complaints matched to next-month domestic violence reports (first 12 rows).")| Year | Month | Borough | DV Reports | Mold Complaints | year_month | time_index | DV_next_month |
|---|---|---|---|---|---|---|---|
| 2010 | 01 - January | BRONX | 910 | 954 | 2010 01 - January | 1 | 818 |
| 2010 | 02 - February | BRONX | 818 | 738 | 2010 02 - February | 2 | 969 |
| 2010 | 03 - March | BRONX | 969 | 941 | 2010 03 - March | 3 | 875 |
| 2010 | 04 - April | BRONX | 875 | 798 | 2010 04 - April | 4 | 940 |
| 2010 | 05 - May | BRONX | 940 | 576 | 2010 05 - May | 5 | 1015 |
| 2010 | 06 - June | BRONX | 1015 | 582 | 2010 06 - June | 6 | 1043 |
| 2010 | 07 - July | BRONX | 1043 | 553 | 2010 07 - July | 7 | 970 |
| 2010 | 08 - August | BRONX | 970 | 528 | 2010 08 - August | 8 | 983 |
| 2010 | 09 - September | BRONX | 983 | 534 | 2010 09 - September | 9 | 914 |
| 2010 | 10 - October | BRONX | 914 | 562 | 2010 10 - October | 10 | 959 |
| 2010 | 11 - November | BRONX | 959 | 513 | 2010 11 - November | 11 | 878 |
| 2010 | 12 - December | BRONX | 878 | 694 | 2010 12 - December | 12 | 1052 |
Because psychological effects related to mold exposure may not develop immediately, I wanted to explore whether there are delayed temporal patterns between mold complaints and domestic violence reports. Specifically, if mold complaints increase in one month, could this be associated with higher levels of domestic violence in the following month?
To examine this, I created a lagged dataset that matches residential mold complaints from one month with domestic violence incidents reported in the following month.
ggplot(dv_mold_lagged, aes(x = `Mold Complaints`, y = DV_next_month)) +
  geom_point(alpha = 0.5, color = "darkgreen") +
  geom_smooth(method = "lm", color = "darkred") +
  labs(
    title = "Next Month DV Reports vs Current Month Mold Complaints",
    x = "Mold Complaints (Current Month)",
    y = "DV Reports (Next Month)"
  ) +
  theme_minimal()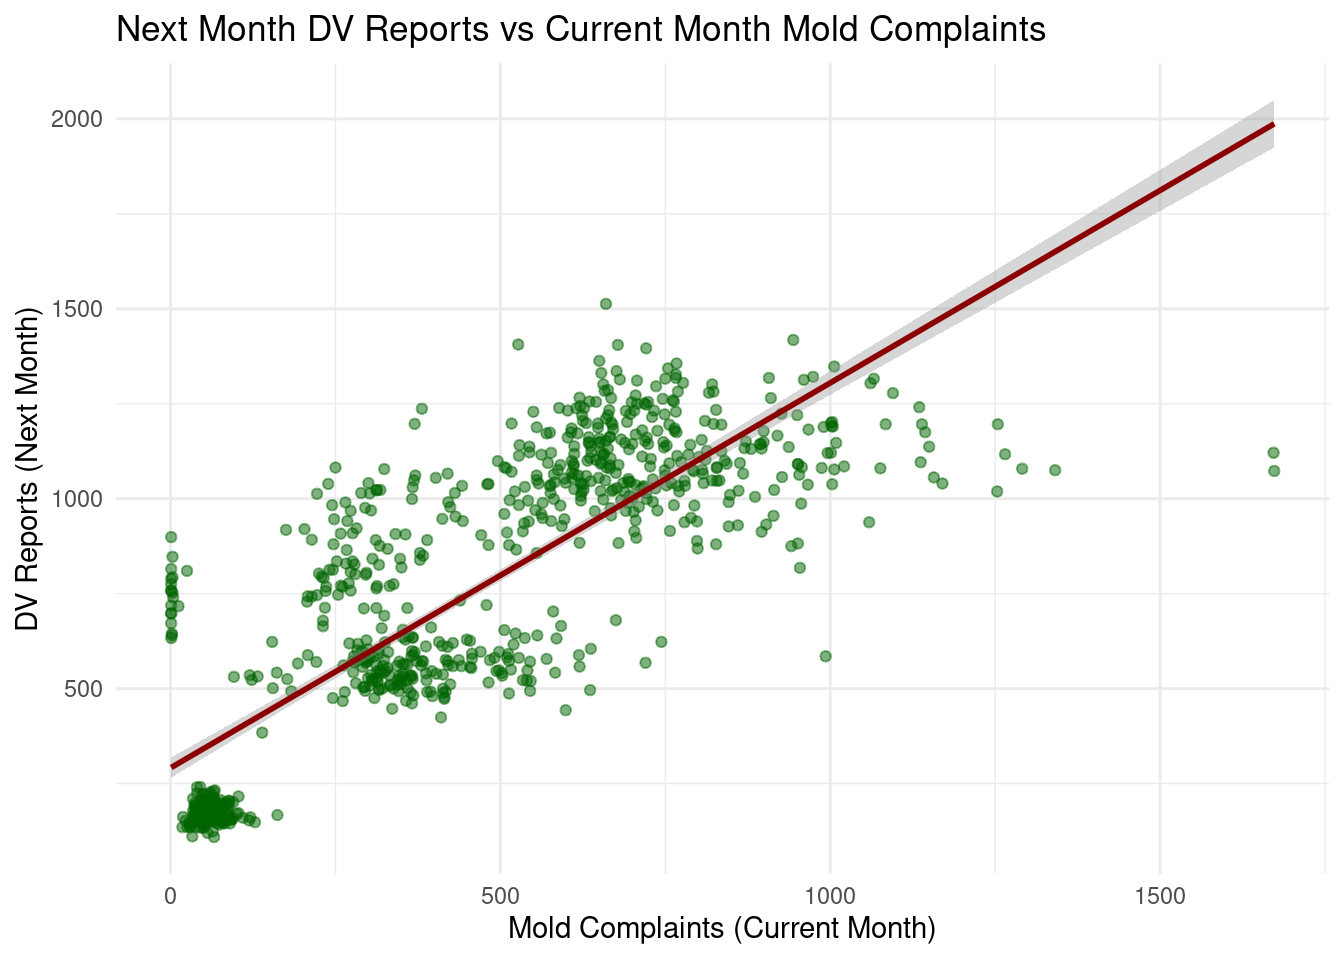
These two variables still look very closely related! But, does time passing really have anything to do with it?
Let’s conduct some statistical tests to dig deeper!
cor.test(dv_mold_lagged$DV_next_month, dv_mold_lagged$`Mold Complaints`)
    Pearson's product-moment correlation

data:  x and y
t = 40.376, df = 805, p-value < 2.2e-16
alternative hypothesis: true correlation is not equal to 0
95 percent confidence interval:
 0.7940136 0.8397855
sample estimates:
      cor
0.8181918
I conducted a Pearson’s correlation test to examine the relationship between mold complaints in one month and DV reports the following month.
Strength: 0.81 (very strong)
Direction: positive
Significance: statistically significant (p<0.05)
The results show a very strong positive correlation, suggesting that months with higher mold complaint counts are associated with higher domestic violence reports in the following month. However, this result is similar to the basic correlation between mold complaints and DV reports (conducted earlier on) and does not account for other factors that might influence the relationship, such as borough.
To better understand how additional variables (such as borough and average resolution time) affect this association, I conducted regression analyses.
aggregated_dv_mold_data <- aggregated_dv_mold_data %>%
  mutate(Borough = factor(Borough)) %>%
  arrange(Year, Month)

lm_dv_mold <- lm(`DV Reports` ~ `Mold Complaints`,
  data = aggregated_dv_mold_data)

summary(lm_dv_mold)
Call:
lm(formula = `DV Reports` ~ `Mold Complaints`, data = aggregated_dv_mold_data)

Residuals:
   Min     1Q Median     3Q    Max
-920.1 -164.7  -41.6  150.6  626.1

Coefficients:
                   Estimate Std. Error t value Pr(>|t|)
(Intercept)       285.96840   13.20783   21.65   <2e-16 ***
`Mold Complaints`   1.02460    0.02438   42.03   <2e-16 ***
---
Signif. codes:  0 '***' 0.001 '**' 0.01 '*' 0.05 '.' 0.1 ' ' 1

Residual standard error: 214.4 on 810 degrees of freedom
  (88 observations deleted due to missingness)
Multiple R-squared:  0.6857,    Adjusted R-squared:  0.6853
F-statistic: 1767 on 1 and 810 DF, p-value: < 2.2e-16AIC(lm_dv_mold)[1] 11025.83This linear regression model tests the association between monthly residential mold complaints and domestic violence reports across all 5 boroughs and all time periods.
Strength: strong (R^2 = 0.67)
Direction: positive
Significance: statistically significant (p<0.05)
AIC: 12160.34
Results suggest a strong and statistically significant positive association between mold complaints and DV reports. On average, months with higher numbers of mold complaints are associated with higher numbers of reported domestic violence incidents. However, this model does not account for differences across boroughs or temporal patterns.
lm_borough <- lm(
  `DV Reports` ~ `Mold Complaints` + Borough,
  data = aggregated_dv_mold_data
)

summary(lm_borough)
Call:
lm(formula = `DV Reports` ~ `Mold Complaints` + Borough, data = aggregated_dv_mold_data)

Residuals:
    Min      1Q  Median      3Q     Max
-257.74  -41.60   -3.30   37.16  396.94

Coefficients:
                       Estimate Std. Error t value Pr(>|t|)
(Intercept)           933.14621   15.35068  60.789  < 2e-16 ***
`Mold Complaints`       0.19321    0.01945   9.935  < 2e-16 ***
BoroughBROOKLYN        59.11542    9.04790   6.534 1.14e-10 ***
BoroughMANHATTAN     -453.73897   11.13873 -40.735  < 2e-16 ***
BoroughQUEENS        -164.57858   14.30008 -11.509  < 2e-16 ***
BoroughSTATEN ISLAND -770.56770   15.65323 -49.227  < 2e-16 ***
---
Signif. codes:  0 '***' 0.001 '**' 0.01 '*' 0.05 '.' 0.1 ' ' 1

Residual standard error: 85.83 on 806 degrees of freedom
  (88 observations deleted due to missingness)
Multiple R-squared:  0.9499,    Adjusted R-squared:  0.9496
F-statistic: 3055 on 5 and 806 DF, p-value: < 2.2e-16AIC(lm_borough)[1] 9543.053This linear regression model tests the association between monthly residential mold complaints and domestic violence reports within each borough rather than across the city.
Strength: very strong (R^2 = 0.94)
Direction: positive
Significance: statistically significant (p<0.05)
AIC: 10571.03
The association between mold complaints and DV reports remains positive and statistically significant. Including boroughs greatly increases the R^2, showing that much of the variation in DV reports is explained by differences between boroughs rather than mold alone. The borough coefficients compare each borough to the Bronx and highlight that DV reporting levels differ substantially across boroughs.
aggregated_dv_mold_data <- aggregated_dv_mold_data %>%
  left_join(mold_monthly_resolution, by = c("Year", "Month"))

lm_resolution_borough <- lm(
  `DV Reports` ~ `Mold Complaints` + Borough + avg_resolution_days,
  data = aggregated_dv_mold_data
)

summary(lm_resolution_borough)
Call:
lm(formula = `DV Reports` ~ `Mold Complaints` + Borough + avg_resolution_days,
    data = aggregated_dv_mold_data)

Residuals:
    Min      1Q  Median      3Q     Max
-257.59  -42.77   -2.31   38.85  376.84

Coefficients:
                       Estimate Std. Error t value Pr(>|t|)
(Intercept)           993.32749   17.99077  55.213  < 2e-16 ***
`Mold Complaints`       0.17433    0.01928   9.041  < 2e-16 ***
BoroughBROOKLYN        59.17692    8.85276   6.685 4.33e-11 ***
BoroughMANHATTAN     -460.04883   10.94783 -42.022  < 2e-16 ***
BoroughQUEENS        -177.24615   14.14608 -12.530  < 2e-16 ***
BoroughSTATEN ISLAND -782.97335   15.45107 -50.674  < 2e-16 ***
avg_resolution_days    -2.88188    0.47425  -6.077 1.89e-09 ***
---
Signif. codes:  0 '***' 0.001 '**' 0.01 '*' 0.05 '.' 0.1 ' ' 1

Residual standard error: 83.98 on 805 degrees of freedom
  (88 observations deleted due to missingness)
Multiple R-squared:  0.9521,    Adjusted R-squared:  0.9517
F-statistic: 2665 on 6 and 805 DF, p-value: < 2.2e-16AIC(lm_resolution_borough)[1] 9508.634This linear regression model continues to test the association while incorporating resolution time of mold complaints.
Strength: very strong (R^2 = 0.95)
Direction: negative
Significance: statistically significant (p<0.05)
AIC: 10539.76
Even after controlling for borough and resolution time, mold complaints remain a statistically significant predictor of DV reports. Average resolution days show a statistically significant negative association with DV reports, suggesting that months with longer resolution delays are associated with fewer reported DV incidents. While this may intuitively feel like the opposite of the expected result, this could be due to many factors, such as a lack of borough/community relationship. For instance, this relationship may have been lower in times where city officials took longer to respond to mold complaints. If there was a low borough/community relationship, it is possible community members felt less confident in filing domestic violence reports, out of lack of perceived resources.
Overall, the final linear regression model is our best predictive model for domestic violence reports. With R^2 of 0.95, and the lowest AIC out of the three regression models (10539.76), this model best supports the hypothesis that domestic violence reports can be predicted by residential mold complaints in the same area at the same time.
Overall, the results show a consistent positive association between residential mold complaints and domestic violence reports. Simple correlations suggest that months with more mold complaints tend to have more DV reports as well. This pattern appears at both yearly and monthly levels.
When borough differences are accounted for in regression models, the relationship between mold complaints and DV reports still remains statistically significant, but weaker. This suggests that while borough-level differences explain much of the variation, mold complaints still have an independent association with DV reports.
Adding average mold resolution time shows that longer resolution delays are associated with lower DV report counts. This may be due to reporting behavior or service engagement rather than a direct effect.
Lagged analyses were used to test whether mold complaints in one month are related to DV reports in the following month. Although the lagged relationship remains positive, it closely resembles the non-lagged results, suggesting that the results may not largely be due to time.
In summary, the analysis suggests a consistent positive relationship between residential mold complaints and domestic violence reports, but borough-level differences and other contextual factors appear to drive much of the variation, highlighting the complexity of environmental and social influences on public health outcomes. In the future, I would like to look at neighborhood-specific trends, or DV/mold rates instead of counts as populations vary across boroughs.