Show the code
library(tidyverse)
library(nycOpenData)
library(dplyr)
library(stringr)NYC Open Data provides numerous datasets about the city “as part of an initiative to improve the accessibility, transparency, and accountability of City government.” My presentation focuses on how public data can help ordinary citizens better understand—and potentially improve—the quality of life in New York City. While my analysis centers around two pre-existing data sets and a relationship between them, it focuses, as much, on how future data collection can be improved to better address the aforementioned goal of holistic improvement.
Many NYC Open Data datasets, such as 311 service request logs, provide valuable information for policymakers, administrators, or individuals with substantial financial or political power. However, these datasets are often difficult for ordinary residents to act upon. The majority of New Yorkers, for example, do not have the capacity to meaningfully influence the housing market.
That said, there are certain types of information that (i) can be directly acted upon by individuals and (ii) can be translated into concrete, low-barrier actions. The field of positive psychology, which consistently finds that strong social relationships are the most reliable predictors of well-being, provides one such framework for identifying this information. One, when considering this area of research, might ask the following:
Can publicly available data be used to explore the conditions that best facilitate social connectedness, and thereby, most enhance quality of life?
The answer, at the moment, is a tentative yes. At present, NYC Open Data does not include the validated measures psychologists typically use to assess metrics like social connectedness and well-being. Instead, researchers and citizens must rely on rough proxies — such as economic metrics. However, over time, the number of resources amenable to the type of analysis I propose can be expanded.
In this exploratory analysis, I examine whether the number of permitted events in a community district (i.e., gatherings, such as street fairs, that require city permits) predicts the number of monthly SNAP recipients in a community district (i.e., low-income individuals who receive benefits that can be used to purchase food). (Note: The acronym SNAP stands for Supplemental Nutrition Assistance Program). I conceptualize permitted events as a rough measure of social connectedness and number of SNAP recipients per month as a rough measure of economic health and, thereby, overall well-being. Yet, rather than treat these variables as definitive measures, I use them as an opportunity to demonstrate how lucrative this mode of research can be. I conclude, also, with a number of suggestions as to how data collection in this field can best be facilitated.
library(tidyverse)
library(nycOpenData)
library(dplyr)
library(stringr)First, I loaded records of NYC permitted events and NYC borough community reports using the NYC Open Data package that my professor (Christian Martinez) created.
Events <- nyc_permit_events_historic(limit = 10000, filters = list())

knitr::kable(
  head(Events, 25),
  caption = "First 25 rows of Events"
)| event_agency | event_id | event_name | start_date_time | end_date_time | event_type | event_borough | event_location | street_closure_type | community_board | police_precinct |
|---|---|---|---|---|---|---|---|---|---|---|
| 43, | NA | NA | NA | NA | NA | NA | NA | NA | NA | NA |
| 43, | NA | NA | NA | NA | NA | NA | NA | NA | NA | NA |
| 43, | NA | NA | NA | NA | NA | NA | NA | NA | NA | NA |
| 43, | NA | NA | NA | NA | NA | NA | NA | NA | NA | NA |
| 43, | NA | NA | NA | NA | NA | NA | NA | NA | NA | NA |
| 43, | NA | NA | NA | NA | NA | NA | NA | NA | NA | NA |
| N/A | NA | NA | NA | NA | NA | NA | NA | NA | NA | NA |
| N/A | NA | NA | NA | NA | NA | NA | NA | NA | NA | NA |
| N/A | NA | NA | NA | NA | NA | NA | NA | NA | NA | NA |
| N/A | NA | NA | NA | NA | NA | NA | NA | NA | NA | NA |
| NA | 21124 | Ganando Almas Para Cristo’|08/28/10 01:00 PM|08/28/10 06:00 PM|Street Activity Permit Office|Religious Event|Bronx| MORRIS AVENUE between EAST 196 STREET and EAST KINGSBRIDGE ROAD|Full|Full Street Closure |7, |52, | | NA | NA | NA | NA | NA | NA | NA | NA |
| 67, | NA | NA | NA | NA | NA | NA | NA | NA | NA | NA |
| 66, | NA | NA | NA | NA | NA | NA | NA | NA | NA | NA |
| 13, | NA | NA | NA | NA | NA | NA | NA | NA | NA | NA |
| 05, | NA | NA | NA | NA | NA | NA | NA | NA | NA | NA |
| 60, | NA | NA | NA | NA | NA | NA | NA | NA | NA | NA |
| 44, | NA | NA | NA | NA | NA | NA | NA | NA | NA | NA |
| Parks Department | 886939 | Summer on the Hudson Holiday on the Hudson | 2026-12-05T16:30:00.000 | 2026-12-05T18:00:00.000 | Special Event | Manhattan | West Harlem Piers: Marginal Street Between 125th 123rd St. | N/A | 9, | 26, |
| Parks Department | 886939 | Summer on the Hudson Holiday on the Hudson | 2026-12-05T16:30:00.000 | 2026-12-05T18:00:00.000 | Special Event | Manhattan | West Harlem Piers: Marginal Street Between 125th 123rd St. | N/A | 9, | 26, |
| Parks Department | 886939 | Summer on the Hudson Holiday on the Hudson | 2026-12-05T16:30:00.000 | 2026-12-05T18:00:00.000 | Special Event | Manhattan | West Harlem Piers: Marginal Street Between 125th 123rd St. | N/A | 9, | 26, |
| Parks Department | 886939 | Summer on the Hudson Holiday on the Hudson | 2026-12-05T16:30:00.000 | 2026-12-05T18:00:00.000 | Special Event | Manhattan | West Harlem Piers: Marginal Street Between 125th 123rd St. | N/A | 9, | 26, |
| Parks Department | 886939 | Summer on the Hudson Holiday on the Hudson | 2026-12-05T16:30:00.000 | 2026-12-05T18:00:00.000 | Special Event | Manhattan | West Harlem Piers: Marginal Street Between 125th 123rd St. | N/A | 9, | 26, |
| Parks Department | 886939 | Summer on the Hudson Holiday on the Hudson | 2026-12-05T16:30:00.000 | 2026-12-05T18:00:00.000 | Special Event | Manhattan | West Harlem Piers: Marginal Street Between 125th 123rd St. | N/A | 9, | 26, |
| Parks Department | 899434 | Junior Volunteer Corps | 2026-12-05T13:00:00.000 | 2026-12-05T15:00:00.000 | Special Event | Brooklyn | Prospect Park: Bandshell South | N/A | 55, | 78, |
| Parks Department | 899434 | Junior Volunteer Corps | 2026-12-05T13:00:00.000 | 2026-12-05T15:00:00.000 | Special Event | Brooklyn | Prospect Park: Bandshell South | N/A | 55, | 78, |
BoroReport <- nyc_borough_community_report(limit = 10000, filters = list())

knitr::kable(
  head(BoroReport, 25),
  caption = "First 25 rows of BoroReport"
)| month | borough | community_district | bc_snap_recipients | bc_snap_households | bc_ca_recipients | bc_ca_cases | bc_ma_only_enrollees | bc_total_ma_enrollees |
|---|---|---|---|---|---|---|---|---|
| 2025-12-01T00:00:00.000 | Staten_Island | S03 | 14183 | 8839 | 3462 | 1993 | 7279 | 13308 |
| 2025-12-01T00:00:00.000 | Staten_Island | S02 | 19167 | 10942 | 4595 | 2567 | 9197 | 17692 |
| 2025-12-01T00:00:00.000 | Staten_Island | S01 | 40297 | 22048 | 16785 | 8121 | 11785 | 36251 |
| 2025-12-01T00:00:00.000 | Queens | Q14 | 31855 | 17882 | 14193 | 6996 | 9789 | 30824 |
| 2025-12-01T00:00:00.000 | Queens | Q13 | 23342 | 15056 | 8083 | 4759 | 12913 | 24695 |
| 2025-12-01T00:00:00.000 | Queens | Q12 | 52623 | 31973 | 23436 | 12541 | 21052 | 53328 |
| 2025-12-01T00:00:00.000 | Queens | Q11 | 10275 | 6927 | 1981 | 1283 | 8094 | 11644 |
| 2025-12-01T00:00:00.000 | Queens | Q10 | 18859 | 11734 | 5194 | 2926 | 9190 | 17077 |
| 2025-12-01T00:00:00.000 | Queens | Q09 | 25156 | 15207 | 6679 | 3906 | 11318 | 21450 |
| 2025-12-01T00:00:00.000 | Queens | Q08 | 22605 | 13818 | 5921 | 3442 | 12419 | 22160 |
| 2025-12-01T00:00:00.000 | Queens | Q07 | 37848 | 25622 | 7613 | 5173 | 25776 | 39440 |
| 2025-12-01T00:00:00.000 | Queens | Q06 | 13669 | 8953 | 2723 | 1633 | 7383 | 13058 |
| 2025-12-01T00:00:00.000 | Queens | Q05 | 19993 | 12553 | 4380 | 2737 | 9402 | 16626 |
| 2025-12-01T00:00:00.000 | Queens | Q04 | 27617 | 17343 | 5211 | 3281 | 13432 | 22694 |
| 2025-12-01T00:00:00.000 | Queens | Q03 | 24590 | 15299 | 5431 | 3182 | 12257 | 21038 |
| 2025-12-01T00:00:00.000 | Queens | Q02 | 12839 | 8565 | 3960 | 2491 | 7543 | 13573 |
| 2025-12-01T00:00:00.000 | Queens | Q01 | 25875 | 16322 | 9416 | 5184 | 11421 | 26181 |
| 2025-12-01T00:00:00.000 | Manhattan | M12 | 46433 | 32949 | 12309 | 7904 | 17751 | 39223 |
| 2025-12-01T00:00:00.000 | Manhattan | M11 | 40559 | 26416 | 15775 | 9652 | 11567 | 35684 |
| 2025-12-01T00:00:00.000 | Manhattan | M10 | 29852 | 20388 | 12280 | 8136 | 8217 | 25951 |
| 2025-12-01T00:00:00.000 | Manhattan | M09 | 21406 | 14633 | 7332 | 4634 | 6939 | 18295 |
| 2025-12-01T00:00:00.000 | Manhattan | M08 | 6855 | 5280 | 2230 | 1537 | 4352 | 8163 |
| 2025-12-01T00:00:00.000 | Manhattan | M07 | 16735 | 12559 | 5818 | 3978 | 7605 | 17311 |
| 2025-12-01T00:00:00.000 | Manhattan | M06 | 7299 | 5760 | 3100 | 2365 | 3079 | 7545 |
| 2025-12-01T00:00:00.000 | Manhattan | M05 | 5155 | 4048 | 4644 | 2495 | 2411 | 8507 |
After this, I removed all non-numeric characters from the community board listings in events and made the community board listings numeric.
Community boards refer to community districts within the five boroughs (and, as a result, function as geographical subdivisions of New York City). There are 59 community boards, as well as a number of so-called “joint-interest areas.” I removed non-numeric characters – such as letters, commas and quotation marks – to standardize the community board notation in the dataset.
eventscleaner <- Events %>%
  mutate(
    cd_id =
      community_board |>
      str_replace_all("[^0-9]", "") |>
      as.numeric()
)In the borough report, I separated the community district field into a borough identifier and a numeric community board. I then recoded the borough identifiers as numeric prefixes and combined these with the community board numbers to create a standardized community district ID. The goal of this transformation was to make the notation in the BoroReport dataset equivalent to that in the Events dataset.
BoroReport <- BoroReport %>%

  mutate(
    snap_borough = str_extract(community_district, "^[A-Za-z]") |> str_to_upper(),
    snap_cb      = str_extract(community_district, "[0-9]+") |> as.numeric()
  ) %>%

  mutate(
    snap_borough_num = case_when(
      snap_borough == "M" ~ 100,  # Manhattan
      snap_borough == "B" ~ 200,  # Bronx
      snap_borough == "K" ~ 300,  # Brooklyn
      snap_borough == "Q" ~ 400,  # Queens
      snap_borough == "S" ~ 500,  # Staten Island
      TRUE ~ NA_real_
    ),

    cd_id = snap_borough_num + snap_cb
)Finally, I applied this same numbering pattern to the events data sheet. I replaced the borough names with numbers and added these numbers to the community districts.
eventscleaner <- eventscleaner %>%

  mutate(
    borough_num = case_when(
      event_borough == "Manhattan"     ~ 100,
      event_borough == "Bronx"         ~ 200,
      event_borough == "Brooklyn"      ~ 300,
      event_borough == "Queens"        ~ 400,
      event_borough == "Staten_Island" ~ 500,
      event_borough == "Staten Island" ~ 500,
      TRUE ~ NA_real_
    ),


    cd_id = borough_num + cd_id
)After this, I glanced at the number of events per community district – just to garner a better understanding of the data.
events_cd <- eventscleaner %>%
  count(cd_id, name = "n_events")

knitr::kable(
  head(events_cd, 30),
  caption = "Number of Events Per CD"
)| cd_id | n_events |
|---|---|
| 101 | 2 |
| 107 | 6 |
| 108 | 277 |
| 109 | 12 |
| 111 | 96 |
| 164 | 235 |
| 211 | 11 |
| 228 | 213 |
| 301 | 16 |
| 302 | 13 |
| 305 | 19 |
| 306 | 21 |
| 307 | 33 |
| 310 | 89 |
| 311 | 6 |
| 312 | 78 |
| 315 | 21 |
| 316 | 13 |
| 318 | 135 |
| 355 | 6290 |
| 377 | 24 |
| 401 | 48 |
| 402 | 140 |
| 405 | 628 |
| 407 | 151 |
| 408 | 747 |
| 411 | 392 |
| 412 | 84 |
| 413 | 22 |
| 481 | 80 |
Across community districts, the mean number of permitted events was 312.5, with a median of 63. (Note: The right skew in the data was due to the number of events in joint-interest areas. These were dropped from the later analysis, due to the lack of SNAP recipients in those areas).
I then created a graph to display the number of events per district, in descending order:
A full list of community districts and joint-interest areas is available here.
events_cd %>%
  slice_max(n_events, n = 25) %>%
  ggplot(aes(x = reorder(cd_id, n_events), y = n_events)) +
  geom_col(fill = "steelblue") +
  coord_flip() +
  labs(
    title = "Number of Events by Community District (Top 25)",
    x = "Community District",
    y = "Number of Events"
  ) +
  theme_minimal()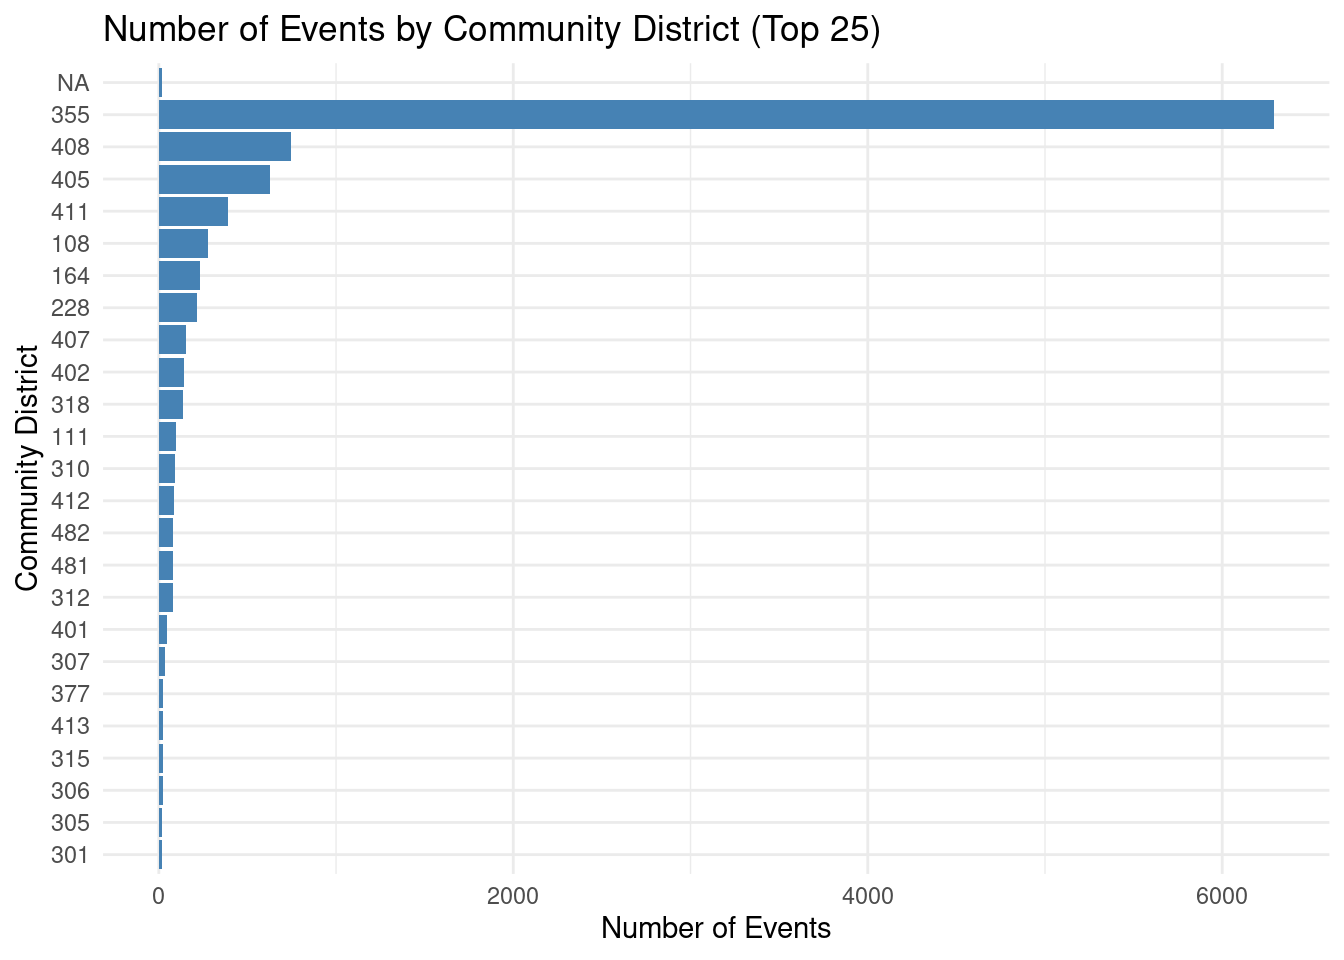
I also looked over the number of SNAP recipients per district.
The table below shows the mean number of SNAP recipients per month per community district. (Note: There are not necessarily equal amounts of people per community district, so number of SNAP recipients within a given district is not a de facto indication of the proportional amount of poverty in the area. That said, it still functions as a meaningful snapshot of poverty rates).
BoroReport <- BoroReport %>%
  mutate(
    bc_snap_recipients = as.numeric(bc_snap_recipients)
  )

snap_plot_data <- BoroReport %>%
  group_by(cd_id) %>%
  summarise(
    bc_snap_recipients = mean(bc_snap_recipients,na.rm = TRUE),
    .groups = "drop"
  )

snap_plot_data %>%
  slice_max(bc_snap_recipients, n = 25) %>%
  ggplot(
    aes(
      x = reorder(cd_id, bc_snap_recipients),
      y = bc_snap_recipients
    )
  ) +
  geom_col(fill = "steelblue") +
  coord_flip() +
  labs(
    title = "SNAP Recipients by Community District (Top 25)",
    x = "Community District",
    y = "SNAP Recipients"
  ) +
  theme_minimal()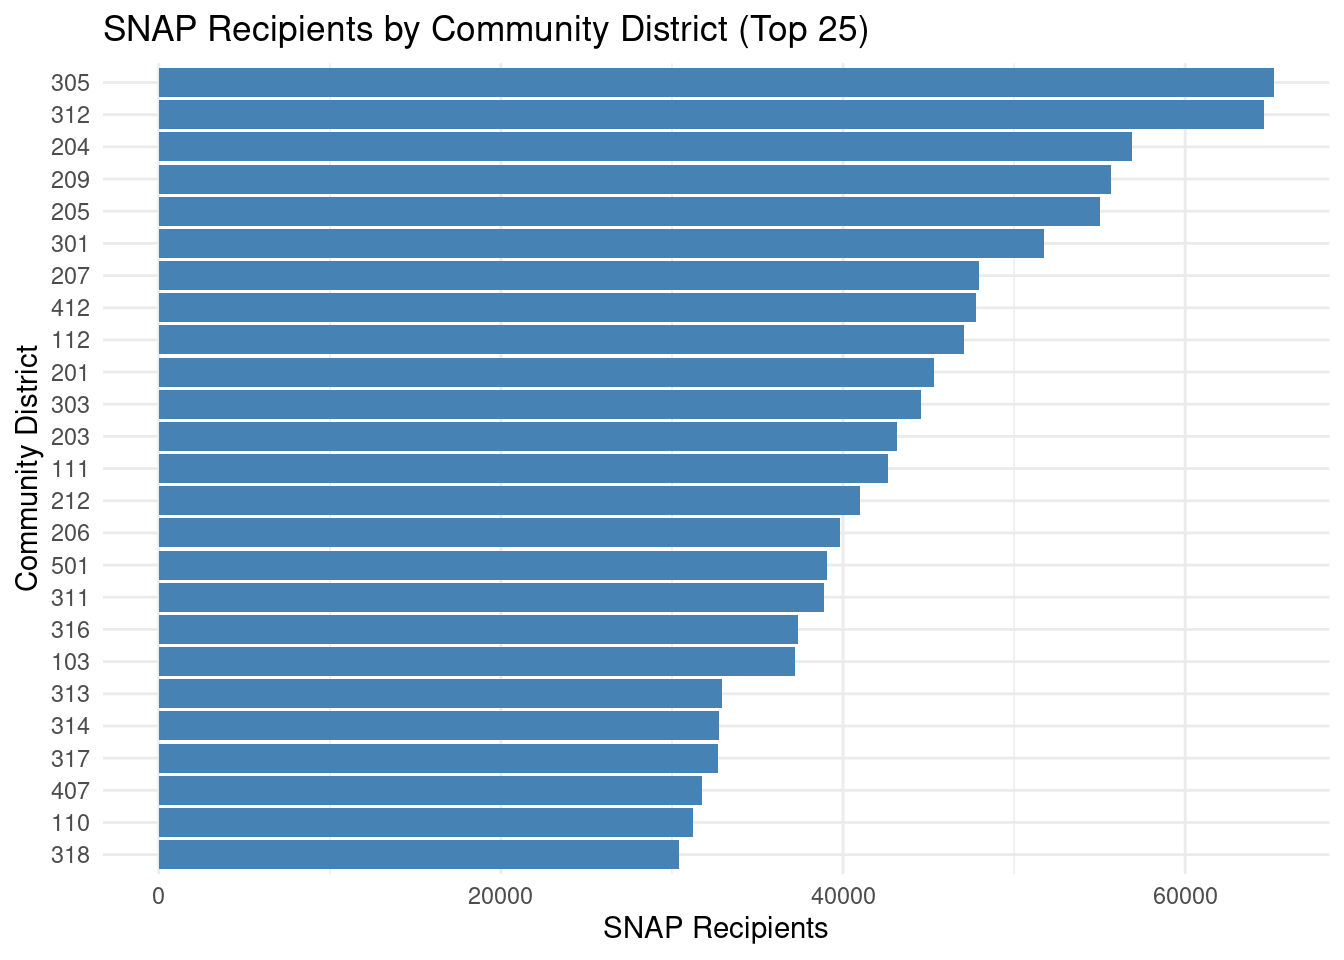
Across community districts, the mean number of SNAP recipients per month was 28608, with a median of 25464.
Finally, I merged the two datasheets using the community district names I created earlier.
merged <- BoroReport %>%
  left_join(events_cd, by = "cd_id")

knitr::kable(
  head(merged, 25),
  caption = "First 25 rows of merged"
)| month | borough | community_district | bc_snap_recipients | bc_snap_households | bc_ca_recipients | bc_ca_cases | bc_ma_only_enrollees | bc_total_ma_enrollees | snap_borough | snap_cb | snap_borough_num | cd_id | n_events |
|---|---|---|---|---|---|---|---|---|---|---|---|---|---|
| 2025-12-01T00:00:00.000 | Staten_Island | S03 | 14183 | 8839 | 3462 | 1993 | 7279 | 13308 | S | 3 | 500 | 503 | NA |
| 2025-12-01T00:00:00.000 | Staten_Island | S02 | 19167 | 10942 | 4595 | 2567 | 9197 | 17692 | S | 2 | 500 | 502 | NA |
| 2025-12-01T00:00:00.000 | Staten_Island | S01 | 40297 | 22048 | 16785 | 8121 | 11785 | 36251 | S | 1 | 500 | 501 | NA |
| 2025-12-01T00:00:00.000 | Queens | Q14 | 31855 | 17882 | 14193 | 6996 | 9789 | 30824 | Q | 14 | 400 | 414 | NA |
| 2025-12-01T00:00:00.000 | Queens | Q13 | 23342 | 15056 | 8083 | 4759 | 12913 | 24695 | Q | 13 | 400 | 413 | 22 |
| 2025-12-01T00:00:00.000 | Queens | Q12 | 52623 | 31973 | 23436 | 12541 | 21052 | 53328 | Q | 12 | 400 | 412 | 84 |
| 2025-12-01T00:00:00.000 | Queens | Q11 | 10275 | 6927 | 1981 | 1283 | 8094 | 11644 | Q | 11 | 400 | 411 | 392 |
| 2025-12-01T00:00:00.000 | Queens | Q10 | 18859 | 11734 | 5194 | 2926 | 9190 | 17077 | Q | 10 | 400 | 410 | NA |
| 2025-12-01T00:00:00.000 | Queens | Q09 | 25156 | 15207 | 6679 | 3906 | 11318 | 21450 | Q | 9 | 400 | 409 | NA |
| 2025-12-01T00:00:00.000 | Queens | Q08 | 22605 | 13818 | 5921 | 3442 | 12419 | 22160 | Q | 8 | 400 | 408 | 747 |
| 2025-12-01T00:00:00.000 | Queens | Q07 | 37848 | 25622 | 7613 | 5173 | 25776 | 39440 | Q | 7 | 400 | 407 | 151 |
| 2025-12-01T00:00:00.000 | Queens | Q06 | 13669 | 8953 | 2723 | 1633 | 7383 | 13058 | Q | 6 | 400 | 406 | NA |
| 2025-12-01T00:00:00.000 | Queens | Q05 | 19993 | 12553 | 4380 | 2737 | 9402 | 16626 | Q | 5 | 400 | 405 | 628 |
| 2025-12-01T00:00:00.000 | Queens | Q04 | 27617 | 17343 | 5211 | 3281 | 13432 | 22694 | Q | 4 | 400 | 404 | NA |
| 2025-12-01T00:00:00.000 | Queens | Q03 | 24590 | 15299 | 5431 | 3182 | 12257 | 21038 | Q | 3 | 400 | 403 | NA |
| 2025-12-01T00:00:00.000 | Queens | Q02 | 12839 | 8565 | 3960 | 2491 | 7543 | 13573 | Q | 2 | 400 | 402 | 140 |
| 2025-12-01T00:00:00.000 | Queens | Q01 | 25875 | 16322 | 9416 | 5184 | 11421 | 26181 | Q | 1 | 400 | 401 | 48 |
| 2025-12-01T00:00:00.000 | Manhattan | M12 | 46433 | 32949 | 12309 | 7904 | 17751 | 39223 | M | 12 | 100 | 112 | NA |
| 2025-12-01T00:00:00.000 | Manhattan | M11 | 40559 | 26416 | 15775 | 9652 | 11567 | 35684 | M | 11 | 100 | 111 | 96 |
| 2025-12-01T00:00:00.000 | Manhattan | M10 | 29852 | 20388 | 12280 | 8136 | 8217 | 25951 | M | 10 | 100 | 110 | NA |
| 2025-12-01T00:00:00.000 | Manhattan | M09 | 21406 | 14633 | 7332 | 4634 | 6939 | 18295 | M | 9 | 100 | 109 | 12 |
| 2025-12-01T00:00:00.000 | Manhattan | M08 | 6855 | 5280 | 2230 | 1537 | 4352 | 8163 | M | 8 | 100 | 108 | 277 |
| 2025-12-01T00:00:00.000 | Manhattan | M07 | 16735 | 12559 | 5818 | 3978 | 7605 | 17311 | M | 7 | 100 | 107 | 6 |
| 2025-12-01T00:00:00.000 | Manhattan | M06 | 7299 | 5760 | 3100 | 2365 | 3079 | 7545 | M | 6 | 100 | 106 | NA |
| 2025-12-01T00:00:00.000 | Manhattan | M05 | 5155 | 4048 | 4644 | 2495 | 2411 | 8507 | M | 5 | 100 | 105 | NA |
I then conducted a linear regression to determine whether number of permitted events predicts number of SNAP recipients. The model was statistically significant, F(1, 723) = 45.34, p < .001, and explained approximately 6% of the variance in SNAP recipients (R² = .059). The number of events was a significant negative predictor of SNAP recipients, b = −21.30, SE = 3.16, t(723) = −6.73, p < .001.
(Note: The model dropped all rows with missing event counts. This means that all joint-interest areas were dropped from the analysis, as well as any months for which there was no event count data)
model1 <- lm(bc_snap_recipients ~ n_events, data = merged)
summary(model1)
Call:
lm(formula = bc_snap_recipients ~ n_events, data = merged)

Residuals:
   Min     1Q Median     3Q    Max
-28120 -12569  -2677   8410  44530

Coefficients:
             Estimate Std. Error t value Pr(>|t|)
(Intercept) 30082.031    705.190  42.658  < 2e-16 ***
n_events      -21.262      3.117  -6.822 1.86e-11 ***
---
Signif. codes:  0 '***' 0.001 '**' 0.01 '*' 0.05 '.' 0.1 ' ' 1

Residual standard error: 16240 on 748 degrees of freedom
  (1020 observations deleted due to missingness)
Multiple R-squared:  0.05857,   Adjusted R-squared:  0.05731
F-statistic: 46.53 on 1 and 748 DF, p-value: 1.859e-11ggplot(
merged,
aes(
x = n_events,
y = bc_snap_recipients
)
) +
geom_point(alpha = 0.6) +
geom_smooth(method = "lm", se = TRUE, color = "red") +
labs(
title = "Permitted Events and SNAP Recipients by Community District",
x = "Permitted Events",
y = "SNAP Recipients"
) +
theme_minimal()`geom_smooth()` using formula = 'y ~ x'Warning: Removed 1020 rows containing non-finite outside the scale range
(`stat_smooth()`).Warning: Removed 1020 rows containing missing values or values outside the scale range
(`geom_point()`).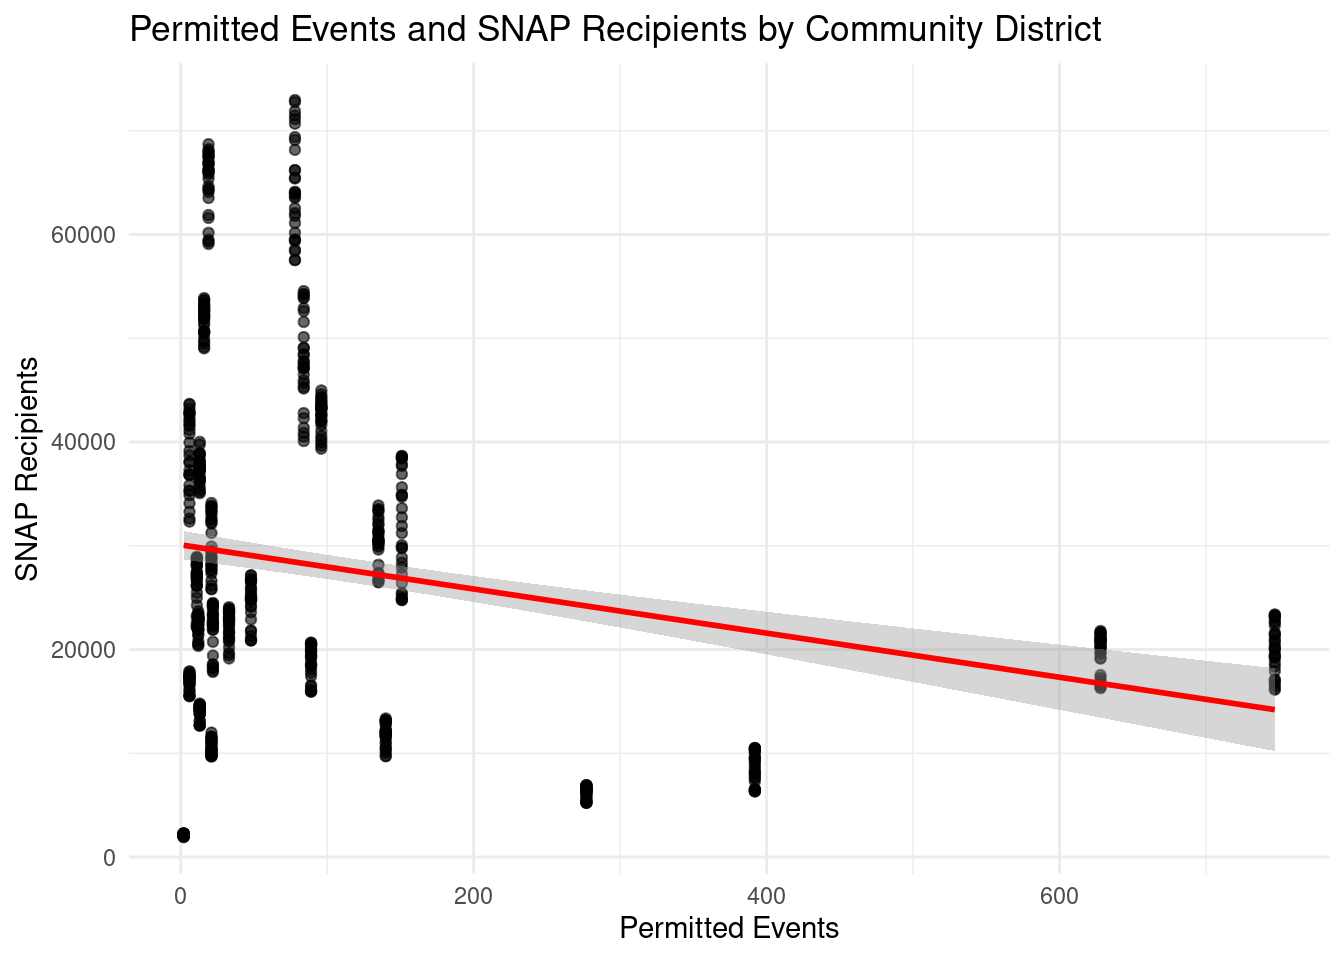
Despite the significant p-value of this analysis, there are a number of limitations. As mentioned in the introduction, the number of SNAP recipients is an imperfect measure of economic well-being (not to mention holistic well-being). Likewise, permitted events are an imperfect indicator of social gatherings in an area. At a more granular level, community districts are not normalized by population size, and major hubs of social activity—such as parks—are excluded from the regression.
However, these limitations point to ways in which data collection could be improved. Below, I outline several possibilities for instantiating such improvements:
Better Dependent Variables
To meaningfully assess quality of life in NYC, future datasets should include more varied indicators of well-being and capture outcomes across the income distribution. Ideally, validated population-level measures of well-being and social connectedness would be available for use as dependent variables. In addition, economic proxies for well-being (such as median income) should be collected. Diverse datasets of this sort would provide a more complete picture of the psychological and economic well-being of NYC residents.
More Information about Social Gatherings
Currently, NYC Open Data has information about permitted events. Yet, there are countless other social gatherings that could be quantified as well. These include volunteer opportunities, Meetup groups, Eventbrite activities, Reddit meetups, and more. While an exhaustive catalog of social gatherings is not feasible, expanded coverage of accessible, low-barrier events would strengthen any analyses of social life in the city. It would also allow analysts to subdivide events in meaningful ways.
Geographic Information
Community districts provide a useful organizational unit, but many NYC datasets lack this data. In addition, even more detailed neighborhood-level data on events might provide information about areas with a shortage (or surplus) of social activity. Identifying such areas might support more strategic intervention. Finally, knowledge of individuals’ willingness (or lack of willingness) to travel might provide yet more valuable information. The prominence of parks in the event data suggests that social life is often organized around specific hubs. The practical accessibility of these hubs is yet another concept worth exploring.
Concrete Suggestions
There is no “control New York City.” As such, causality cannot be established through the analyses I describe. Nevertheless, if evidence were to suggest that certain types of social activities were associated with positive psychological outcomes, it would then be possible to recommend concrete actions to citizens who wished to improve civic and social life in New York. In this way, improved data infrastructure could help foster a stronger sense of civic autonomy among New Yorkers – as well as a happier, healthier New York City.